
Page 45 - NEW FOREX FULL COURSE
P. 45
FOREX TRADING COURSE FOR BEGINNERS
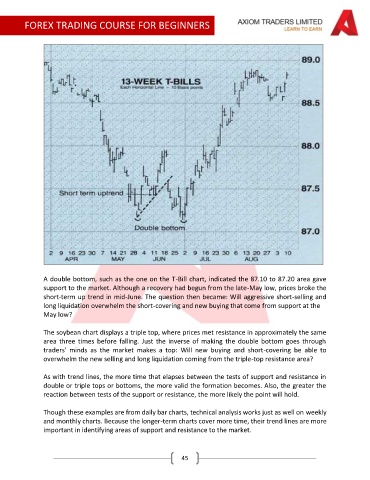
A double bottom, such as the one on the T-Bill chart, indicated the 87.10 to 87.20 area gave
support to the market. Although a recovery had begun from the late-May low, prices broke the
short-term up trend in mid-June. The question then became: Will aggressive short-selling and
long liquidation overwhelm the short-covering and new buying that come from support at the
May low?
The soybean chart displays a triple top, where prices met resistance in approximately the same
area three times before falling. Just the inverse of making the double bottom goes through
traders' minds as the market makes a top: Will new buying and short-covering be able to
overwhelm the new selling and long liquidation coming from the triple-top resistance area?
As with trend lines, the more time that elapses between the tests of support and resistance in
double or triple tops or bottoms, the more valid the formation becomes. Also, the greater the
reaction between tests of the support or resistance, the more likely the point will hold.
Though these examples are from daily bar charts, technical analysis works just as well on weekly
and monthly charts. Because the longer-term charts cover more time, their trend lines are more
important in identifying areas of support and resistance to the market.
45