
Page 5 - Viscosity measurement and prediction of gasified and synthesized coal slag melts
P. 5
524 Arman et al. / Fuel 200 (2017) 521–528
due to temperature measurement, and the composition change of
the melt during the measurement. The total error thus was esti-
mated as 6.7% in the previous study. Another previous study
reported that the error of rotational cylinder method was esti-
mated with a uncertainty of 10% [20].
The viscosity of 50CaO–50SiO 2 (mol%) slag melt was measured
to compare with the previously reported values of Mizoguchi et al.
[21]. The comparison between present study and the previous
study confirmed that the measured viscosities were close agree-
ment with previously reported values [21] within the deviation
of 1.5%.
3.2. Viscosity measurements
The viscosities as a function of temperature are shown in
Figs. 3 and 4 for gasified coal and synthesized slag melts, respec-
tively. The Arrhenius model is obtained an expression of tempera-
ture dependence for silicate melts using only two parameters [22]:
Log g ¼ log a þ b=T ð1Þ
where g is the viscosity, a and b are the fitting parameters, and T is
the temperature. The ability of Eq. (1) to describe the temperature
dependence of viscosity has been fitted with dashed lines. The solid
circles represent the experimental viscosity data of gasified and
synthesized slag melts. The dot lines will be considered latter
according to Eq. (8) of Urbain model.
3.2.1. Gasified coal slag melts
Fig. 3 shows the temperature dependences of the viscosity of
coal slag melts in the temperature range 1300–1650 °C. The vis-
cosities of CV, TH, and MA coal slag melts gradually increase with
decreasing temperature as a general trend in slag melts [23], while
the viscosity of AD slag melt exhibits the rapid increase at 1300 °C.
The viscosity of slag melts rapidly increases below the temperature
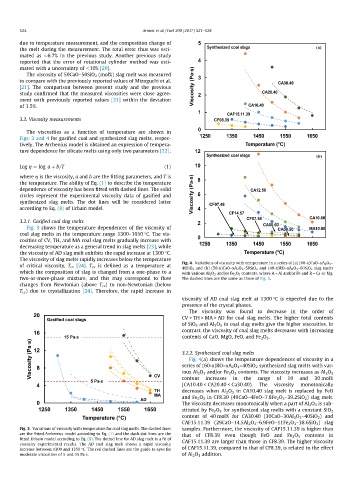
Fig. 4. Variations of viscosity with temperature in a series of (a) (60-x)CaO–xA 2 O 3 –
of critical viscosity, T cv [24]. T cv is defined as a temperature at
40SiO 2 and (b) (50-x)CaO–xA 2 O 3 –50SiO 2 and (40-x)RO–xA 2 O 3 –60SiO 2 slag melts
which the composition of slag is changed from a one-phase to a with various Al 2 O 3 and/or Fe 2 O 3 contents, where A = Al and/or Fe and R = Ca or Mg.
two-or-more-phase mixture, and this may correspond to flow The dashed lines are the same as those of Fig. 3.
changes from Newtonian (above T cv ) to non-Newtonian (below
T cv ) due to crystallization [24]. Therefore, the rapid increase in
viscosity of AD coal slag melt at 1300 °C is expected due to the
presence of the crystal phases.
The viscosity was found to decrease in the order of
CV > TH > MA > AD for coal slag melts. The higher total contents
of SiO 2 and Al 2 O 3 in coal slag melts give the higher viscosities. In
contrast, the viscosity of coal slag melts decreases with increasing
contents of CaO, MgO, FeO, and Fe 2 O 3 .
3.2.2. Synthesized coal slag melts
Fig. 4(a) shows the temperature dependences of viscosity in a
series of (60-x)RO–xA 2 O 3 –40SiO 2 synthesized slag melts with var-
ious Al 2 O 3 and/or Fe 2 O 3 contents. The viscosity increases as Al 2 O 3
content increases in the range of 10 and 30 mol%
(CA10.40 < CA20.40 < Ca30.40). The viscosity monotonically
decreases when Al 2 O 3 in CA10.40 slag melt is replaced by FeO
and Fe 2 O 3 in CF8.39 (49CaO–4FeO–7.8Fe 2 O 3 –39.2SiO 2 ) slag melt.
The viscosity decreases monotonically when a part of Al 2 O 3 is sub-
stituted by Fe 2 O 3 for synthesized slag melts with a constant SiO 2
content of 40 mol% for CA30.40 (30CaO–30Al 2 O 3 –40SiO 2 ) and
CAF15.11.39 (29CaO–14.5Al 2 O 3 –6.9FeO–11Fe 2 O 3 –38.6SiO 2 ) slag
Fig. 3. Variations of viscosity with temperature for coal slag melts. The dashed lines samples. Furthermore, the viscosity of CAF15.11.39 is higher than
are the fitted Arrhenius model according to Eq. (1) and the dash-dot lines are the that of CF8.39 even though FeO and Fe 2 O 3 contents in
fitted Urbain model according to Eq. (8). The dotted line for AD slag melt is a fit of
viscosity experimental results. The AD coal slag melt shows a rapid viscosity CAF15.11.39 are larger than those in CF8.39. The higher viscosity
increase between 1300 and 1350 °C. The red dashed lines are the guide to eyes for of CAF15.11.39, compared to that of CF8.39, is related to the effect
moderate viscosities of 5 and 15 Pa s. of Al 2 O 3 addition.