Page 35 - IILMGSM Journal_Management Perspective
P. 35
24 years were 23% of the respondents, whereas Table1: Most Frequently watched advertising
almost half i.e. 49% of the respondents ages ranged Medium
between 25-33 years. About 28 % of the respondent
stand between 34-42 years old. In other words, Frequency Percent Valid Cumulative
approximately 72% of the respondents fall below 33
years of age. Interestingly, the sample was almost Percent Percent
balanced between married 52%, and the unmarried
48% respondents. Magazines 20 9.6 9.6 9.6
The education profile of the surveyed respondents Newspaper 44 21.2 21.2 30.8
indicates that 70% of the respondents had
undergraduate degree and 20% with high school and Internet 42 20.2 20.2 51
only 10% had postgraduate degrees. About 29% of
the respondents earned less than Rs.20000 a month, Radio 22 10.6 10.6 61.5
51% of them earned between Rs.20000 and 50000,
and 20% more than 50000. Television 54 26 26 87.5
The data analysis was performed to draw conclusions Hoardings 4 1.9 1.9 89.4
out from the data to present the answer to the
statement of the problem. (Zikmund 2003) defined Emails 22 10.6 10.6 100
descriptive analysis as the transformation of raw data
into a form that will make them easy to understand 208 100 100
and interpret, and then to draw conclusions out of it.
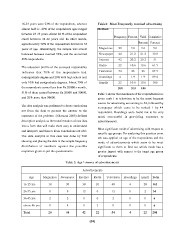
The data analysis in this case was done by first Table 1 shows that maximum of the respondents have
showing and placing the data in the sample frequency given rank 1 to television to be the most frequent
distribution of members against the possible source for advertising accounting to 54, followed by
responses given as per the questionnaire. newspaper which came to be ranked 1 by 44
respondent. Hoardings were found not to be very
much successful in providing exposure to
advertisements.
Most significant mode of advertising with respect to
specific age groups: For analyzing this question cross
tab was applied on age of the respondents and the
mode of advertisements which seem to be most
significant to them to find out which mode has a
greater impact with respect to the target age group
of respondents.
Table 2: Age * source of advertisements
Advertisements
Age Magazines Newspaper Internet Radio Television Hoardings Email Total
16-25 yrs 18 30 30 20 40 4 20 162
26-35 yrs 0 8 12 0 12 0 2 34
36-45 yrs 2 2 00 2 0 06
above 46 yrs 0 4 02 0 0 06
Total 20 44 42 22 54 4 22 208
(34)
almost half i.e. 49% of the respondents ages ranged Medium
between 25-33 years. About 28 % of the respondent
stand between 34-42 years old. In other words, Frequency Percent Valid Cumulative
approximately 72% of the respondents fall below 33
years of age. Interestingly, the sample was almost Percent Percent
balanced between married 52%, and the unmarried
48% respondents. Magazines 20 9.6 9.6 9.6
The education profile of the surveyed respondents Newspaper 44 21.2 21.2 30.8
indicates that 70% of the respondents had
undergraduate degree and 20% with high school and Internet 42 20.2 20.2 51
only 10% had postgraduate degrees. About 29% of
the respondents earned less than Rs.20000 a month, Radio 22 10.6 10.6 61.5
51% of them earned between Rs.20000 and 50000,
and 20% more than 50000. Television 54 26 26 87.5
The data analysis was performed to draw conclusions Hoardings 4 1.9 1.9 89.4
out from the data to present the answer to the
statement of the problem. (Zikmund 2003) defined Emails 22 10.6 10.6 100
descriptive analysis as the transformation of raw data
into a form that will make them easy to understand 208 100 100
and interpret, and then to draw conclusions out of it.
The data analysis in this case was done by first Table 1 shows that maximum of the respondents have
showing and placing the data in the sample frequency given rank 1 to television to be the most frequent
distribution of members against the possible source for advertising accounting to 54, followed by
responses given as per the questionnaire. newspaper which came to be ranked 1 by 44
respondent. Hoardings were found not to be very
much successful in providing exposure to
advertisements.
Most significant mode of advertising with respect to
specific age groups: For analyzing this question cross
tab was applied on age of the respondents and the
mode of advertisements which seem to be most
significant to them to find out which mode has a
greater impact with respect to the target age group
of respondents.
Table 2: Age * source of advertisements
Advertisements
Age Magazines Newspaper Internet Radio Television Hoardings Email Total
16-25 yrs 18 30 30 20 40 4 20 162
26-35 yrs 0 8 12 0 12 0 2 34
36-45 yrs 2 2 00 2 0 06
above 46 yrs 0 4 02 0 0 06
Total 20 44 42 22 54 4 22 208
(34)