Page 38 - IILMGSM Journal_Management Perspective
P. 38
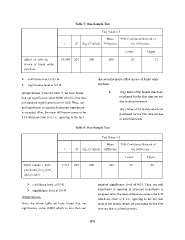
Table 7: One-Sample Test
Test Value = 3
Mean 95% Confidence Interval of
t df Sig. (2-tailed) Difference the Difference
Lower Upper
Effect_of_advt_on_ -15.540 207 .000 -.808 -.91 -.71
choice_of_brand_while_
purchase
confidence level at 95 % that advertisements affect choice of brand while
significance level at 0.5 % purchase.
Interpretations- From the table 7, we have found I. (H0): Most of the brands which are
that our significance value 0.000 which is less than purchased for the first time are not
our standard significance level of 0.05. Thus, our due to advertisements.
null hypothesis is rejected & alternate hypothesis
is accepted. Also, the mean difference comes to be (H ): Most of the brands which are
2.19 which is close to 2, i.e., agreeing to the fact 1
purchased for the first time are due
to advertisements.
Table 8: One-Sample Test
Test Value = 3
Mean 95% Confidence Interval of
t df Sig. (2-tailed) Difference the Difference
Lower Upper
Most_brands_i_have_ -9.714 207 .000 -.654 -.79 -.52
purchased_first_time_
due_to_advt
confidence level at 95 % standard significance level of 0.05. Thus, our null
significance level at 0.5 % hypothesis is rejected & alternate hypothesis is
accepted. Also, the mean difference comes to be 2.35
Interpretations- which are close to 2, i.e., agreeing to the fact that
most of the brands which are purchased for the first
From the above table we have found that our time are due to advertisements.
significance value 0.000 which is less than our
(37)
Test Value = 3
Mean 95% Confidence Interval of
t df Sig. (2-tailed) Difference the Difference
Lower Upper
Effect_of_advt_on_ -15.540 207 .000 -.808 -.91 -.71
choice_of_brand_while_
purchase
confidence level at 95 % that advertisements affect choice of brand while
significance level at 0.5 % purchase.
Interpretations- From the table 7, we have found I. (H0): Most of the brands which are
that our significance value 0.000 which is less than purchased for the first time are not
our standard significance level of 0.05. Thus, our due to advertisements.
null hypothesis is rejected & alternate hypothesis
is accepted. Also, the mean difference comes to be (H ): Most of the brands which are
2.19 which is close to 2, i.e., agreeing to the fact 1
purchased for the first time are due
to advertisements.
Table 8: One-Sample Test
Test Value = 3
Mean 95% Confidence Interval of
t df Sig. (2-tailed) Difference the Difference
Lower Upper
Most_brands_i_have_ -9.714 207 .000 -.654 -.79 -.52
purchased_first_time_
due_to_advt
confidence level at 95 % standard significance level of 0.05. Thus, our null
significance level at 0.5 % hypothesis is rejected & alternate hypothesis is
accepted. Also, the mean difference comes to be 2.35
Interpretations- which are close to 2, i.e., agreeing to the fact that
most of the brands which are purchased for the first
From the above table we have found that our time are due to advertisements.
significance value 0.000 which is less than our
(37)