Page 36 - IILMGSM Journal_Management Perspective
P. 36
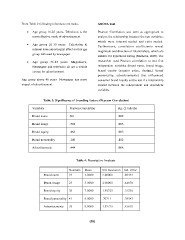
m Table 2 following inferences are made- ANOVA Test
Age group 16-25 years- Television is the Pearson Correlation was seen as appropriate to
most effective mode of advertisement. analyze the relationship between the two variables,
which were interval-scaled and ratio-scaled.
Age group 26-35 years- Television & Furthermore, correlation coefficients reveal
internet have almost equal effect on this age magnitude and direction of relationships, which are
group followed by newspaper. suitable for hypothesis testing (Malhotra, 2007). The
researcher used Pearson correlation to test five
Age group 36-45 years- Magazines, independent variables (brand name, brand image,
Newspaper and television all are a visible brand equity (consist price, design,) brand
source for advertisement. personality, advertisements) that influenced
consumer brand loyalty and to test if a relationship
Age group above 46 years- Newspaper has most existed between the independent and dependent
impact of advertisement variables.
Table 3: Significance of branding factors (Pearson Correlation)
Variables Pearson Correlation Sig. (2-tailed)a
Brand name 561 .002
Brand image .304 .003
Brand equity .466 .005
Brand personality .140 .162
Advertisements .444 .006
Table 4: Descriptive Analysis
Numbers Mean Std. Deviation Std. Error
24 3.0000
Brand name 2.00000 .89443
Brand image 25 3.0000 2.00000 .44678
Brand equity 38 7.0000 1.92725 .31256
Brand personality 43 6.0000 .70711 .76543
Advertisements 78 9.0000 1.92725 .45678
(35)