Page 61 - IILMGSM Journal_Management Perspective
P. 61
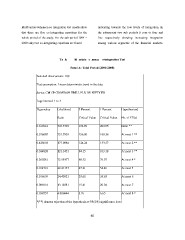
tivariate Johansen co-integration test results show indicating towards the low levels of integration. In
that there are five co-integrating equations for the the subsequent two sub periods it rose to four and
whole period of the study. For the sub period 1994 – five respectively showing increasing integration
2000 only two co-integrating equations are found among various segments of the financial markets.
Table 5 Multivariate Johansen Co-integration Test
Panel A: Total Period (2000-2008)
Included observations: 100
Test assumption: Linear deterministic trend in the data
Series: CM CP CD MIBOR TBILL PLR DR NIFTY ER
Lags interval: 1 to 4
Eigenvalue Likelihood 5 Percent 1 Percent Hypothesized
Ratio Critical Value Critical Value No. of CE(s)
0.616912 347.7392 192.89 204.95 None **
0.526602 251.7903 156.00 168.36 At most 1 **
0.428010 177.0084 124.24 133.57 At most 2 **
0.384828 121.1451 94.15 103.18 At most 3 **
0.260281 72.55977 68.52 76.07 At most 4 *
0.164781 42.41133 47.21 54.46 At most 5
0.106639 24.40521 29.68 35.65 At most 6
0.086916 13.12881 15.41 20.04 At most 7
0.039557 4.036044 3.76 6.65 At most 8 *
*(**) denotes rejection of the hypothesis at 5%(1%) significance level
60