Page 62 - IILMGSM Journal_Management Perspective
P. 62
. test indicates 5 co-integrating equation(s) at 5% significance level
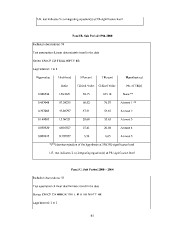
Panel B: Sub Period 1994-2000
Included observations: 74
Test assumption: Linear deterministic trend in the data
Series: CM CP CD TBILL NIFTY ER
Lags interval: 1 to 2
Eigenvalue Likelihood 5 Percent 1 Percent Hypothesized
Ratio Critical Value Critical Value No. of CE(s)
0.606526 156.2651 94.15 103.18 None **
0.457048 87.24235 68.52 76.07 At most 1 **
0.297069 42.04797 47.21 54.46 At most 2
0.149083 15.96321 29.68 35.65 At most 3
0.050320 4.016567 15.41 20.04 At most 4
0.002645 0.195957 3.76 6.65 At most 5
*(**) denotes rejection of the hypothesis at 5%(1%) significance level
L.R. test indicates 2 co-integrating equation(s) at 5% significance level
Panel C: Sub Period 2000 – 2004
Included observations: 53
Test assumption: Linear deterministic trend in the data
Series: CM CP CD MIBOR TBILL PLR DR NIFTY ER
Lags interval: 1 to 1
61