Page 63 - IILMGSM Journal_Management Perspective
P. 63
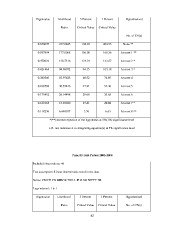
envalue Likelihood 5 Percent 1 Percent Hypothesized
Ratio Critical Value Critical Value
No. of CE(s)
0.678097 237.0825 192.89 204.95 None **
0.597894 177.0068 156.00 168.36 At most 1 **
0.470923 128.7216 124.24 133.57 At most 2 *
0.421464 94.98072 94.15 103.18 At most 3 *
0.380560 65.97623 68.52 76.07 At most 4
0.238598 40.59246 47.21 54.46 At most 5
0.175452 26.14498 29.68 35.65 At most 6
0.160165 15.92020 15.41 20.04 At most 7 *
0.118236 6.669037 3.76 6.65 At most 8 **
*(**) denotes rejection of the hypothesis at 5%(1%) significance level
L.R. test indicates 4 co-integrating equation(s) at 5% significance level
Panel D: Sub Period 2005-2008
Included observations: 46
Test assumption: Linear deterministic trend in the data
Series: CM CP CD MIBOR TBILL PLR DR NIFTY ER
Lags interval: 1 to 1
Eigenvalue Likelihood 5 Percent 1 Percent Hypothesized
No. of CE(s)
Ratio Critical Value Critical Value
62
Ratio Critical Value Critical Value
No. of CE(s)
0.678097 237.0825 192.89 204.95 None **
0.597894 177.0068 156.00 168.36 At most 1 **
0.470923 128.7216 124.24 133.57 At most 2 *
0.421464 94.98072 94.15 103.18 At most 3 *
0.380560 65.97623 68.52 76.07 At most 4
0.238598 40.59246 47.21 54.46 At most 5
0.175452 26.14498 29.68 35.65 At most 6
0.160165 15.92020 15.41 20.04 At most 7 *
0.118236 6.669037 3.76 6.65 At most 8 **
*(**) denotes rejection of the hypothesis at 5%(1%) significance level
L.R. test indicates 4 co-integrating equation(s) at 5% significance level
Panel D: Sub Period 2005-2008
Included observations: 46
Test assumption: Linear deterministic trend in the data
Series: CM CP CD MIBOR TBILL PLR DR NIFTY ER
Lags interval: 1 to 1
Eigenvalue Likelihood 5 Percent 1 Percent Hypothesized
No. of CE(s)
Ratio Critical Value Critical Value
62