
Page 50 - 2021_MJ_Complete
P. 50
This environment provides an averaged 5.4% annual growth from overcrowded, which could pres-
opportunity to examine correctional 1991 to 2007. 7 ent significant capital challenges
expenditures and consider strate- To support state and local efforts to local budgets.
gies that may offer enduring public to reduce jail spending and protect
safety and fiscal benefits. The avail- public safety, The Pew Charitable Jail costs rose even as crime and
5
able data indicates that to mitigate Trusts undertook an analysis of jail admissions to jail fell. As of the
COVID-19 exposure risk, jurisdic- costs, using expenditure data for end of 2017:
tions reduced jail populations by all U.S. localities, primarily from • A 20% decrease in crime and a
about 31% nationwide from March 2007 and 2017, and related criminal 19% drop in jail admissions since
to May 2020, and although those justice data. 2007 had not led to reduced jail
populations partially rebounded, Key findings include: spending.
they were still 15% below March • The portion of local budgets
levels as of October 2020. Further, Local governments spend billions spent on jails did not correlate
6
people released from jail in March on jails. As of the end of 2017: with state crime rates.
were readmitted less often over • Jail and other local corrections
the ensuing six months than those costs had risen sixfold since • Small localities spent more per
released in January, suggesting that 1977, with jail costs reaching $25 capita on jails than most other
the pandemic-related decreases in billion. jurisdictions, despite having
jail populations did not affect public • Almost 2 in 5 dollars spent on lower crime rates.
safety. These reductions may not state and local correctional insti- Nationwide, counties and cities
yield immediate savings, but a sus- tutions went to jails. are seeking to address budgetary
tained commitment to safely cutting • About 1 in 17 county dollars was pressures during these difficult
the number of people in jail could spent on jails. fiscal times and for the long term.
provide long-term financial benefits. New policies and practices—
The recent experience of reducing • The average annual cost of hold- including many they already have
prison populations offers a glimpse ing a person in jail was about embraced in response to the pan-
of the potential cost savings: The $34,000. demic—can safely reduce jail popu-
9% drop in the prison population • Roughly a third of jail facility lations and associated costs and
from 2008 to 2018 virtually flattened capacity was more than 30 years help them achieve those goals.
corrections spending, which had old, and about 20% of jails were
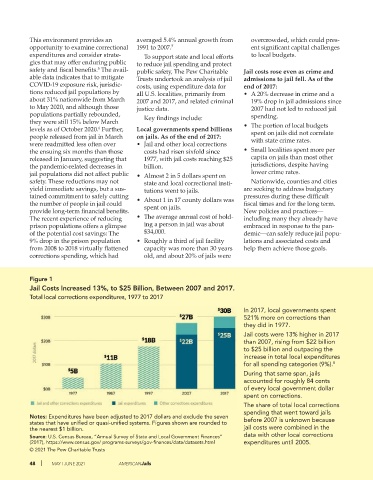
Figure 1
Jail Costs Increased 13%, to $25 Billion, Between 2007 and 2017.
Total local corrections expenditures, 1977 to 2017
In 2017, local governments spent
521% more on corrections than
they did in 1977.
Jail costs were 13% higher in 2017
than 2007, rising from $22 billion
to $25 billion and outpacing the
increase in total local expenditures
for all spending categories (9%). 8
During that same span, jails
accounted for roughly 84 cents
of every local government dollar
spent on corrections.
The share of total local corrections
spending that went toward jails
Notes: Expenditures have been adjusted to 2017 dollars and exclude the seven before 2007 is unknown because
states that have unified or quasi-unified systems. Figures shown are rounded to
the nearest $1 billion. jail costs were combined in the
Source: U.S. Census Bureau, “Annual Survey of State and Local Government Finances” data with other local corrections
(2017), https://www.census.gov/ programs-surveys/gov-finances/data/datasets.html expenditures until 2005.
© 2021 The Pew Charitable Trusts
48 | MAY | JUNE 2021 AMERICANJails