
Page 53 - 2021_MJ_Complete
P. 53
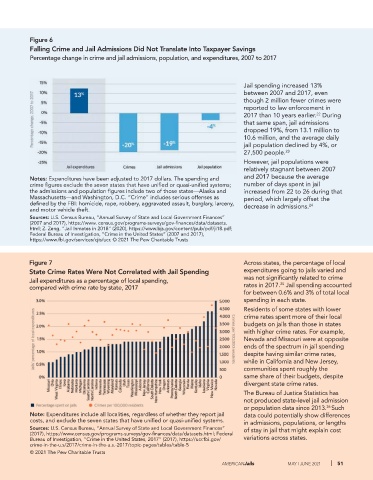
Figure 6
           Falling Crime and Jail Admissions Did Not Translate Into Taxpayer Savings
           Percentage change in crime and jail admissions, population, and expenditures, 2007 to 2017


                                                                                Jail spending increased 13%
                                                                                between 2007 and 2017, even
                                                                                though 2 million fewer crimes were
                                                                                reported to law enforcement in
                                                                                2017 than 10 years earlier.  During
                                                                                                       22
                                                                                that same span, jail admissions
                                                                                dropped 19%, from 13.1 million to
                                                                                10.6 million, and the average daily
                                                                                jail population declined by 4%, or
                                                                                27,500 people. 23
                                                                                However, jail populations were
                                                                                relatively stagnant between 2007
           Notes: Expenditures have been adjusted to 2017 dollars. The spending and   and 2017 because the average
           crime figures exclude the seven states that have unified or quasi-unified systems;   number of days spent in jail
           the admissions and population figures include two of those states—Alaska and   increased from 22 to 26 during that
           Massachusetts—and Washington, D.C. “Crime” includes serious offenses as   period, which largely offset the
           defined by the FBI: homicide, rape, robbery, aggravated assault, burglary, larceny,   decrease in admissions. 24
           and motor vehicle theft.
           Sources: U.S. Census Bureau, “Annual Survey of State and Local Government Finances”
           (2007 and 2017), https://www. census.gov/programs-surveys/gov-finances/data/datasets.
           html; Z. Zeng, “Jail Inmates in 2018” (2020), https://www.bjs.gov/content/pub/pdf/ji18.pdf;
           Federal Bureau of Investigation, “Crime in the United States” (2007 and 2017),
           https://www.fbi.gov/services/cjis/ucr. © 2021 The Pew Charitable Trusts


           Figure 7                                                             Across states, the percentage of local
           State Crime Rates Were Not Correlated with Jail Spending             expenditures going to jails varied and
           Jail expenditures as a percentage of local spending,                 was not significantly related to crime
                                                                                            25
           compared with crime rate by state, 2017                              rates in 2017.  Jail spending accounted
                                                                                for between 0.6% and 3% of total local
                                                                                spending in each state.
                                                                                Residents of some states with lower
                                                                                crime rates spent more of their local
                                                                                budgets on jails than those in states
                                                                                with higher crime rates. For example,
                                                                                Nevada and Missouri were at opposite
                                                                                ends of the spectrum in jail spending
                                                                                despite having similar crime rates,
                                                                                while in California and New Jersey,
                                                                                communities spent roughly the
                                                                                same share of their budgets, despite
                                                                                divergent state crime rates.
                                                                                The Bureau of Justice Statistics has
                                                                                not produced state-level jail admission
                                                                                or population data since 2013. Such
                                                                                                           26
           Note: Expenditures include all localities, regardless of whether they report jail   data could potentially show differences
           costs, and exclude the seven states that have unified or quasi-unified systems.  in admissions, populations, or lengths
           Sources: U.S. Census Bureau, “Annual Survey of State and Local Government Finances”   of stay in jail that might explain cost
           (2017), https://www.census.gov/programs-surveys/gov-finances/data/datasets.html; Federal
           Bureau of Investigation, “Crime in the United States, 2017” (2017), https://ucr.fbi.gov/  variations across states.
           crime-in-the-u.s/2017/crime-in-the-u.s.-2017/topic-pages/tables/table-5
           © 2021 The Pew Charitable Trusts
                                                                         AMERICANJails        MAY | JUNE 2021   |  51