
Page 7 - Avoid Food and Drug Interactions
P. 7
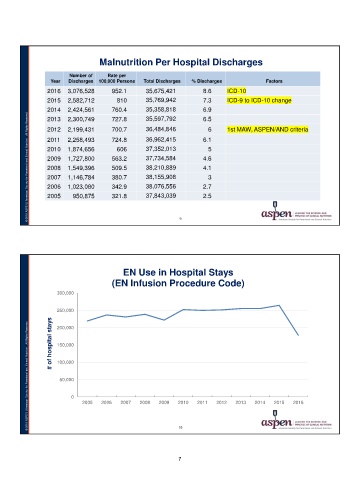
Malnutrition Per Hospital Discharges

                                                                                                  Number of  Rate per

                                                                                            Year Discharges 100,000 Persons  Total Discharges  % Discharges  Factors

                                                                                            2016  3,076,528  952.1            35,675,421       8.6 ICD-10
                                                                                            2015  2,582,712    810            35,769,942
                                                                                            2014  2,424,561                   35,358,818       7.3 ICD-9 to ICD-10 change
                                                                                            2013  2,300,749  760.4            35,597,792
© 2019 ASPEN | American Society for Parenteral and Enteral Nutrition. All Rights Reserved.                   727.8            36,484,846       6.9
                                                                                                                              36,962,415
                                                                                                                              37,352,013       6.5
                                                                                                                              37,734,584
                                                                                            2012 2,199,431   700.7            38,210,889       6 1st MAW, ASPEN/AND criteria
                                                                                                                              38,155,908
                                                                                            2011  2,258,493  724.8            38,076,556       6.1
                                                                                            2010  1,874,656    606            37,843,039
                                                                                            2009  1,727,800                                    5
                                                                                            2008  1,549,396  563.2
                                                                                            2007  1,146,784  509.5                             4.6
                                                                                            2006  1,023,080  380.7                             4.1
                                                                                            2005             342.9
                                                                                                    950,875  321.8                             3

                                                                                                                                               2.7

                                                                                                                                               2.5

                                                                                                                             9

© 2019 ASPEN | American Society for Parenteral and Enteral Nutrition. All Rights Reserved.                       EN Use in Hospital Stays
                                                                                                             (EN Infusion Procedure Code)
          # of hospital stays
                                                                                            300,000
                                                                                            250,000
                                                                                            200,000
                                                                                            150,000
                                                                                            100,000

                                                                                             50,000
                                                                                                     0
                                                                                                            2005 2006 2007 2008 2009 2010 2011 2012 2013 2014 2015 2016

                                                                                                                                                                                                         10

                                                                                                                                                                 7