
Page 9 - Avoid Food and Drug Interactions
P. 9
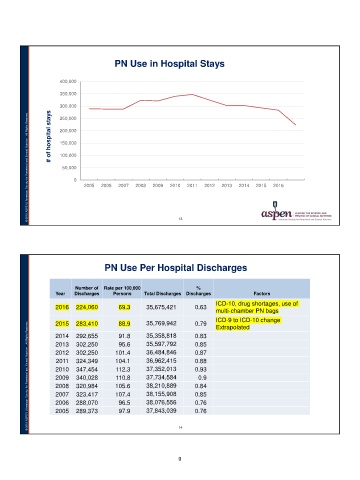
© 2019 ASPEN | American Society for Parenteral and Enteral Nutrition. All Rights Reserved.                   PN Use in Hospital Stays

          # of hospital stays                                                               400,000
                                                                                            350,000
                                                                                            300,000
                                                                                            250,000
                                                                                            200,000
                                                                                            150,000
                                                                                            100,000

                                                                                             50,000
                                                                                                     0
                                                                                                           2005 2006 2007 2008 2009 2010 2011 2012 2013 2014 2015 2016

                                                                                                                                                                                                       13

                                                                                                              PN Use Per Hospital Discharges

                                                                                                  Number of Rate per 100,000                  %

                                                                                            Year  Discharges  Persons         Total Discharges Discharges  Factors

                                                                                            2016 224,060      69.3 35,675,421                 0.63         ICD-10, drug shortages, use of
                                                                                                                                                           multi-chamber PN bags

© 2019 ASPEN | American Society for Parenteral and Enteral Nutrition. All Rights Reserved.  2015 283,410       88.9           35,769,942      0.79         ICD-9 to ICD-10 change
                                                                                                                                                           Extrapolated
                                                                                                               91.8           35,358,818
                                                                                            2014  292,655      95.6           35,597,792      0.83
                                                                                            2013  302,250     101.4           36,484,846
                                                                                            2012  302,250     104.1           36,962,415      0.85
                                                                                            2011  324,349     112.3           37,352,013
                                                                                            2010  347,454     110.8           37,734,584      0.87
                                                                                            2009  340,028     105.6           38,210,889
                                                                                            2008  320,984     107.4           38,155,908      0.88
                                                                                            2007  323,417      96.5           38,076,556
                                                                                            2006  288,070      97.9           37,843,039      0.93
                                                                                            2005  289,373
                                                                                                                                              0.9

                                                                                                                                              0.84

                                                                                                                                              0.85

                                                                                                                                              0.76

                                                                                                                                              0.76

                                                                                                                                          14

                                                                                                                                          9