Page 278 - ABCTE Study Guide_Neat
P. 278

Step by Step:

            1.  Decide on the number of classes, or bins. The width of the intervals depends on these. The
                table below shows 6 classes.
                 2.    Now find the widths of the intervals: Widths of five years are shown on the table below.


                                         Class                               Frequency

                                        42 - 46                                  5

                                        47 - 51                                  6
                                        52 - 56                                  8

                                        57 - 61                                  7

                                        62 - 66                                  5

                                        67 - 71                                  4


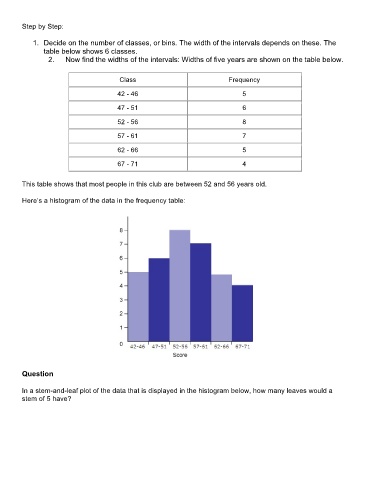
        This table shows that most people in this club are between 52 and 56 years old.

        Here’s a histogram of the data in the frequency table:


        Question


        In a stem-and-leaf plot of the data that is displayed in the histogram below, how many leaves would a
        stem of 5 have?
   273   274   275   276   277   278   279   280   281   282   283