
Page 279 - ABCTE Study Guide_Neat
P. 279
A 8
B 11
C 21
D Cannot be determined
Answer
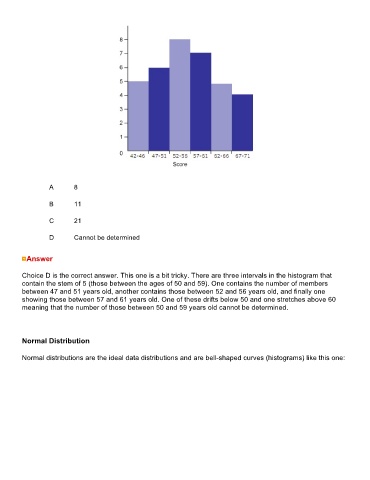
Choice D is the correct answer. This one is a bit tricky. There are three intervals in the histogram that
contain the stem of 5 (those between the ages of 50 and 59). One contains the number of members
between 47 and 51 years old, another contains those between 52 and 56 years old, and finally one
showing those between 57 and 61 years old. One of these drifts below 50 and one stretches above 60
meaning that the number of those between 50 and 59 years old cannot be determined.
Normal Distribution
Normal distributions are the ideal data distributions and are bell-shaped curves (histograms) like this one: