
Page 275 - Deep Learning
P. 275
258 Adaptation
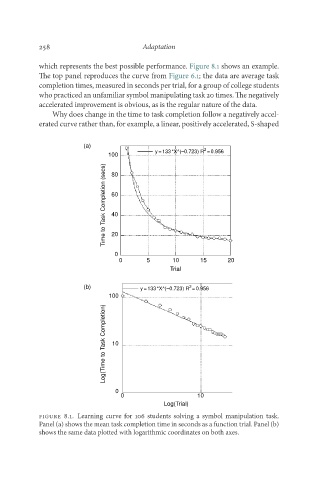
which represents the best possible performance. Figure 8.1 shows an example.
The top panel reproduces the curve from Figure 6.1; the data are average task
completion times, measured in seconds per trial, for a group of college students
who practiced an unfamiliar symbol manipulating task 20 times. The negatively
accelerated improvement is obvious, as is the regular nature of the data.
Why does change in the time to task completion follow a negatively accel-
erated curve rather than, for example, a linear, positively accelerated, S-shaped
(a)
2
y=133 *X^(–0.723) R =0.956
100
Time to Task Completion (secs) 60
80
40
20
0
0 5 10 15 20
Trial
(b) y=133 *X^(–0.723) R =0.956
2
100
Log(Time to Task Completion) 10
0
0 10
Log(Trial)
Figure 8.1. Learning curve for 106 students solving a symbol manipulation task.
Panel (a) shows the mean task completion time in seconds as a function trial. Panel (b)
shows the same data plotted with logarithmic coordinates on both axes.