
Page 277 - Deep Learning
P. 277
260 Adaptation
(a) 5
4
Number of Errors 3
2
1
0
0 2 4 6 8 10
Trial
(b) 10
1
Log(Errors)
0.1
0.01
0 2 4 6 8 10
Trial
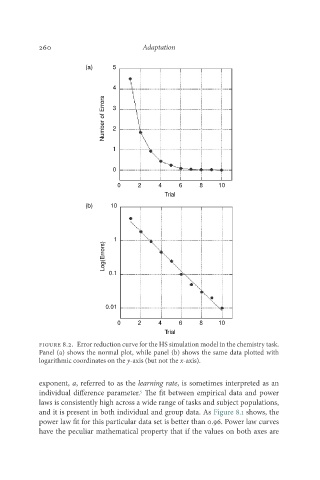
Figure 8.2. Error reduction curve for the HS simulation model in the chemistry task.
Panel (a) shows the normal plot, while panel (b) shows the same data plotted with
logarithmic coordinates on the y-axis (but not the x-axis).
exponent, a, referred to as the learning rate, is sometimes interpreted as an
individual difference parameter. The fit between empirical data and power
5
laws is consistently high across a wide range of tasks and subject populations,
and it is present in both individual and group data. As Figure 8.1 shows, the
power law fit for this particular data set is better than 0.96. Power law curves
have the peculiar mathematical property that if the values on both axes are