
Page 6 - statistical mathematics
P. 6
typically only a part of the whole population, sample data provide only limited
information about the population. As a result, sample statistics are generally
imperfect representatives of the corresponding population parameters. the part
of statistics that draws conclusions from data (using some model for the data):
For example, inferential statistics involves selecting a model for the data,
checking whether the data fulfill the conditions of a particular model, and with
quantifying the involved uncertainty (e.g. using confidence intervals).
Representation of Data
There are different ways to represent data such as through graphs, charts or
tables. The general representation of statistical data are:
Bar Graph
A Bar Graph represents grouped data with rectangular bars with lengths
proportional to the values that they represent. The bars can be plotted
vertically or horizontally.
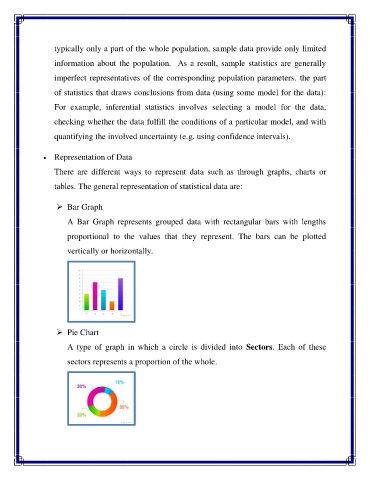
Pie Chart
A type of graph in which a circle is divided into Sectors. Each of these
sectors represents a proportion of the whole.