
Page 7 - statistical mathematics
P. 7
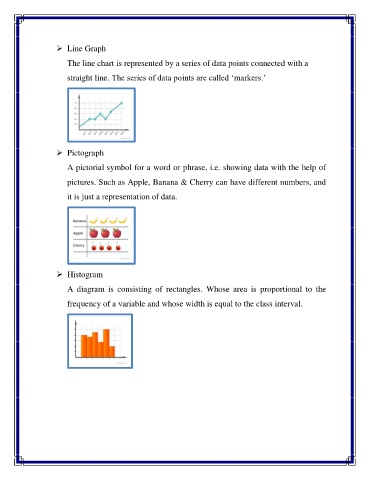
Line Graph
The line chart is represented by a series of data points connected with a
straight line. The series of data points are called „markers.‟
Pictograph
A pictorial symbol for a word or phrase, i.e. showing data with the help of
pictures. Such as Apple, Banana & Cherry can have different numbers, and
it is just a representation of data.
Histogram
A diagram is consisting of rectangles. Whose area is proportional to the
frequency of a variable and whose width is equal to the class interval.