
Page 55 - Banking Finance December 2019
P. 55
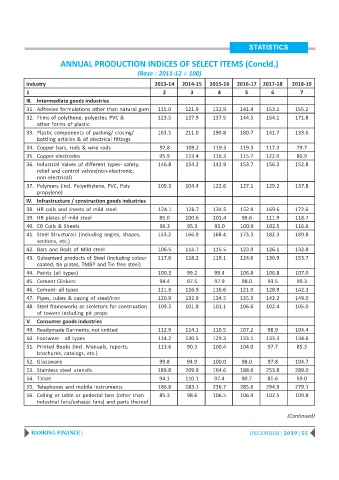
STATISTICS

                      ANNUAL PRODUCTION INDICES OF SELECT ITEMS (Concld.)

                                                 (Base : 2011-12 = 100)
          Industry                                     2013-14   2014-15   2015-16  2016-17  2017-18    2018-19
          1                                               2         3         4        5        6         7
          III. Intermediate goods industries
          31. Adhesive formulations other than natural gum  115.0  121.9    132.9    141.4    153.1      155.2
          32. Films of polythene, polyester, PVC &      123.5     127.9     137.5    144.5    164.1      171.8
              other forms of plastic
          33. Plastic components of packing/ closing/   163.5     211.0     190.8    180.7    141.7      133.6
              bottling articles & of electrical fittings
          34. Copper bars, rods & wire rods              92.8     109.2     119.3    119.3    117.3      79.7
          35. Copper electrodes                          95.9     113.4     116.3    115.7    122.0      80.9
          36. Industrial Valves of different types- safety,  146.8  154.2   142.9    153.7    156.3      152.8
              relief and control valves(non-electronic,
              non-electrical)
          37. Polymers (incl. Polyethylene, PVC, Poly   109.3     104.4     122.6    127.1    129.2      137.8
              propylene)
          IV. Infrastructure / construction goods industries
          38. HR coils and sheets of mild steel          124.1    126.7     134.5    152.9    169.6      172.6
          39. HR plates of mild steel                    85.0     100.6     101.4     98.6    111.9      118.7
          40. CR Coils & Sheets                          96.3      95.3     95.0     100.9    102.5      116.6
          41. Steel Structurals (including angles, shapes,  153.2  166.9    168.4    173.3    182.3      189.8
              sections, etc.)
          42. Bars and Rods of Mild steel                106.5    114.7     115.5    123.9    126.1      132.8
          43. Galvanised products of Steel (including colour  117.6  118.2  119.1    124.6    130.9      153.7
              coated, tin plates, TMBP and Tin free steel)
          44. Paints (all types)                        100.3      99.2     99.4     106.8    106.8      107.0
          45. Cement Clinkers                            94.4      97.5     97.9      98.0     93.5      99.3
          46. Cement- all types                         111.8     116.9     116.6    121.0    128.9      142.3
          47. Pipes, tubes & casing of steel/iron       120.9     132.9     134.5    135.3    142.2      149.0
          48. Steel frameworks or skeletons for construction  109.3  101.8  101.1    106.6    102.4      105.0
              of towers including pit props
          V.  Consumer goods industries
          49. Readymade Garments, not knitted           112.9     114.1     110.5    107.2     98.9      104.4
          50. Footwear - all types                      114.2     130.5     129.3    133.1    133.3      134.6
          51. Printed Books (incl. Manuals, reports,    113.6      90.3     100.4    104.0     97.7      85.3
              brochures, catalogs, etc.)
          52. Glassware                                  99.8      94.9     100.0     98.0     97.8      104.7
          53. Stainless steel utensils                  189.8     209.9     164.6    188.6    253.8      289.0
          54. T.V.set                                    94.1     110.1     97.4      90.7     81.6      59.0
          55. Telephones and mobile instruments         186.8     183.1     236.7    285.6    294.9      279.1
          56. Ceiling or table or pedestal fans (other than  85.3  98.6     106.5    106.9    102.5      109.8
              industrial fans/exhaust fans) and parts thereof

                                                                                                      (Continued)

            BANKING FINANCE |                                                            DECEMBER | 2019 | 55