
Page 56 - Banking Finance December 2019
P. 56
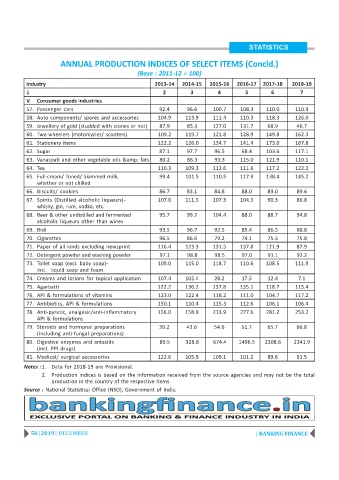
STATISTICS

                      ANNUAL PRODUCTION INDICES OF SELECT ITEMS (Concld.)

                                                 (Base : 2011-12 = 100)
          Industry                                     2013-14   2014-15   2015-16  2016-17  2017-18    2018-19
          1                                               2         3         4        5        6         7
          V.  Consumer goods industries
          57. Passenger cars                             92.4      96.6     100.7    108.3    110.0      110.9
          58. Auto components/ spares and accessories   104.9     113.9     111.4    110.3    118.3      126.0
          59. Jewellery of gold (studded with stones or not)  87.9  85.3    127.0    131.7     68.9      46.7
          60. Two-wheelers (motorcycles/ scooters)      109.2     119.7     121.8    128.9    149.8      162.3
          61. Stationery items                          122.2     126.0     134.7    141.4    173.0      167.8
          62. Sugar                                      87.1      97.7     96.5      68.4    103.6      117.1
          63. Vanaspati and other vegetable oils & fats  80.2  86.3     93.3     115.0    121.9      110.1
          64. Tea                                       110.3     109.3     112.6    111.6    117.2      122.2
          65. Full-cream/ Toned/ Skimmed milk,           99.4     101.5     110.5    117.9    138.4      145.2
              whether or not chilled
          66. Biscuits/ cookies                          86.7      83.1     84.8      88.0     89.0      89.6
          67. Spirits (Distilled alcoholic liqueurs)-   107.0     111.5     107.3    104.5     90.3      86.8
              whisky, gin, rum, vodka, etc.
          68. Beer & other undistilled and fermented     95.7      99.2     104.4     88.0     88.7      94.8
              alcoholic liqueurs other than wines
          69. Bidi                                       93.5      96.7     92.5      85.4     86.5      88.8
          70. Cigarettes                                 96.5      86.6     79.2      74.1     75.5      75.8
          71. Paper of all kinds excluding newsprint    116.4     123.3     131.5    137.8    121.9      87.9
          72. Detergent powder and washing powder        97.1      98.8     98.5      97.0     91.1      92.2
          73. Toilet soap (excl. baby soap)-            109.0     115.0     118.7    110.6    108.5      111.9
              incl.  liquid soap and foam
          74. Creams and lotions for topical application  107.4   102.4     28.2      17.5     12.4       7.1
          75. Agarbatti                                 122.2     136.2     137.8    135.1    118.7      115.4
          76. API & formulations of vitamins            123.0     122.4     118.2    111.0    104.7      117.2
          77. Antibiotics, API & formulations           150.1     110.4     115.3    112.6    106.1      106.4
          78. Anti-pyretic, analgesic/anti-inflammatory  156.0    158.9     213.9    277.6    281.2      253.2
              API & formulations
          79. Steroids and hormonal preparations         39.2      43.6     54.6      51.7     65.7      66.8
              (including anti-fungal preparations)
          80. Digestive enzymes and antacids             89.5     328.8     674.4    1496.5   2308.6    2341.9
              (incl. PPI drugs)
          81. Medical/ surgical accessories             122.6     105.9     109.1    101.2     89.6      91.5
         Notes :1. Data for 2018-19 are Provisional.
                2. Production indices is based on the information received from the source agencies and may not be the total
                   production in the country of the respective items.
         Source : National Statistical Office (NSO), Government of India.


            56 | 2019 | DECEMBER                                                           | BANKING FINANCE