


Page 44 - The Insurance Times February 2026
P. 44
Y   Compulsory (motor), or                           Life density: up; non-life density: flat
         Y   Employer-driven (group health), or               Life density moved from USD 70 to USD 72, while non-life
                                                              density stayed around USD 25.
         Y   Claim-difficult (a perception problem), rather than

         Y   A routine protection purchase.                   What this implies:
                                                              India is spending slightly more per person on insurance, but
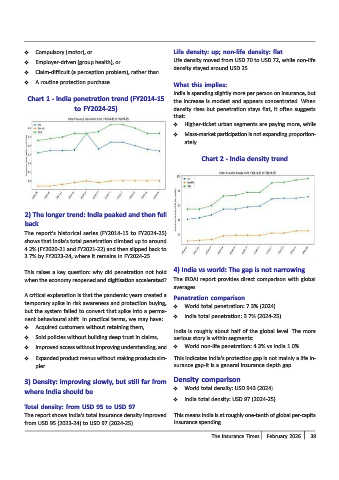
          Chart 1 - India penetration trend (FY2014-15        the increase is modest and appears concentrated. When
                           to FY2024-25)                      density rises but penetration stays flat, it often suggests
                                                              that:
                                                              Y  Higher-ticket urban segments are paying more, while
                                                              Y  Mass-market participation is not expanding proportion-
                                                                 ately.

                                                                       Chart 2 - India density trend


         2) The longer trend: India peaked and then fell
         back
         The report's historical series (FY2014-15 to FY2024-25)
         shows that India's total penetration climbed up to around
         4.2% (FY2020-21 and FY2021-22) and then slipped back to
         3.7% by FY2023-24, where it remains in FY2024-25.

         This raises a key question: why did penetration not hold  4) India vs world: The gap is not narrowing
         when the economy reopened and digitisation accelerated?  The IRDAI report provides direct comparison with global
                                                              averages.
         A critical explanation is that the pandemic years created a  Penetration comparison
         temporary spike in risk awareness and protection buying,
                                                              Y  World total penetration: 7.3% (2024)
         but the system failed to convert that spike into a perma-
         nent behavioural shift. In practical terms, we may have:  Y  India total penetration: 3.7% (2024-25)
         Y   Acquired customers without retaining them,
                                                              India is roughly about half of the global level. The more
         Y   Sold policies without building deep trust in claims,  serious story is within segments:
         Y   Improved access without improving understanding, and  Y  World non-life penetration: 4.3% vs India 1.0%
         Y   Expanded product menus without making products sim-  This indicates India's protection gap is not mainly a life in-
             pler.                                            surance gap-it is a general insurance depth gap.

         3) Density: improving slowly, but still far from     Density comparison
         where India should be                                Y  World total density: USD 943 (2024)
                                                              Y  India total density: USD 97 (2024-25)
         Total density: from USD 95 to USD 97
         The report shows India's total insurance density improved  This means India is at roughly one-tenth of global per-capita
         from USD 95 (2023-24) to USD 97 (2024-25).           insurance spending.

                                                                           The Insurance Times  February 2026  39

