
Page 7 - Life Insurance Today July - December 2020
P. 7
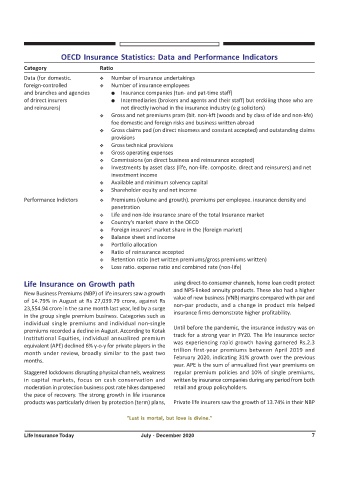
OECD Insurance Statistics: Data and Performance Indicators
         Category                   Ratio
         Data (for domestic.        Y   Number of insurance undertakings
         foreign-controlled         Y   Number of insurance employees
         and branches and agencies      O  Insurance companies (tun- and pat-time staff)
         of drirect insurers            O  Intermediaries (brokers and agents and their staff) but erckiiing those who are
         and reinsurers)                    not directly iwohad in the insurance industry (e g solicitors)
                                    Y   Gross and net premiums pram (bit. non-kft (woods and by class of Ide and non-kfe)
                                        foe domestic and foreign risks and business written abroad
                                    Y   Gross claims pad (on direct nisomess and constant accepted) and outstanding claims
                                        provisions
                                    Y   Gross technical provisions
                                    Y   Gross operating expenses
                                    Y   Commissions (on direct business and reinsurance accepted)
                                    Y   Investments by asset class (life, non-life. composite. direct and reinsurers) and net
                                        investment income
                                    Y   Available and minimum solvency capital
                                    Y   Shareholder equity and net income
         Performance Indictors      Y   Premiums (volume and growth). premiums per employee. insurance density and
                                        penetration
                                    Y   Life and non-Ide insurance snare of the total Insurance market
                                    Y   Country's market share in the OECD
                                    Y   Foreign insurers' market share in the (foreign market)
                                    Y   Balance sheet and income
                                    Y   Portfolio allocation
                                    Y   Ratio of reinsurance accepted
                                    Y   Retention ratio (net written premiums/gross premiums written)
                                    Y   Loss ratio. expense ratio and combined rate (non-life)


         Life Insurance on Growth path                        using direct-to-consumer channels, home loan credit protect
                                                              and NPS-linked annuity products. These also had a higher
         New Business Premiums (NBP) of life insurers saw a growth
                                                              value of new business (VNB) margins compared with par and
         of 14.79% in August at Rs 27,039.79 crore, against Rs
                                                              non-par products, and a change in product mix helped
         23,554.94 crore in the same month last year, led by a surge
         in the group single premium business. Categories such as  insurance firms demonstrate higher profitability.
         individual single premiums and individual non-single
                                                              Until before the pandemic, the insurance industry was on
         premiums recorded a decline in August. According to Kotak
                                                              track for a strong year in FY20. The life insurance sector
         Institutional Equities, individual annualized premium
         equivalent (APE) declined 6% y-o-y for private players in the  was experiencing rapid growth having garnered Rs.2.3
         month under review, broadly similar to the past two  trillion first-year premiums between April 2019 and
         months.                                              February 2020, indicating 31% growth over the previous
                                                              year. APE is the sum of annualized first year premiums on
         Staggered lockdowns disrupting physical channels, weakness  regular premium policies and 10% of single premiums,
         in capital markets, focus on cash conservation and   written by insurance companies during any period from both
         moderation in protection business post rate hikes dampened  retail and group policyholders.
         the pace of recovery. The strong growth in life insurance
         products was particularly driven by protection (term) plans,  Private life insurers saw the growth of 13.74% in their NBP

                                             "Lust is mortal, but love is divine."


         Life Insurance Today                     July - December 2020                                         7