
Page 85 - Insurance Statistics 2021
P. 85
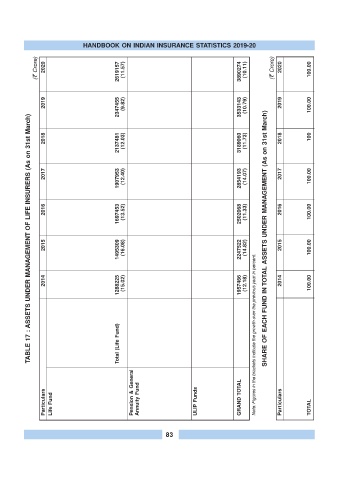
HANDBOOK ON INDIAN INSURANCE STATISTICS 2019-20

              (r Crore)  2020  1110475  (13.54)  586418  (11.60)  275434  (8.79)  508685  (9.02)  138145  (11.28)  2619157  (11.57)  295279  (24.31)  379429  (10.92)  223338  (14.73)  898045  (15.99)  349193  (-7.81)  23879  (-26.85)  373072  (-9.32)  3890274  (10.11)  (r Crore)  2020  67.32  23.08  9.60  100.00


                 2019  978085  (11.32)  525454  (4.56)  253187  (8.51)  466588  (3.67)  124141  (70.13)  2347455  (9.82)  237538  (24.36)  342066  (17.97)  194658  (1.03)  774262  (14.94)  378781  (6.22)  32645  (53.02)  411425  (8.86)  3533143  (10.79)  2019  66.44  21.91  11.65  100.00


            TABLE 17 : ASSETS UNDER MANAGEMENT OF LIFE INSURERS (As on 31st March)


                 2018  878610  (10.81)  502519  (13.59)  233327  (16.41)  450055  (10.99)  72969  (9.41)  2137481  (12.03)  191013  (20.68)  289955  (28.29)  192671  (5.81)  673639  (18.93)  356608  (-1.42)  21333  (17.89)  377941  (-0.50)  3189060  (11.73)  2018  67.03  21.12  11.85  100


                 2017  792928  (13.83)  442416  (17.22)  200438  (7.70)  405477  (0.32)  66694  (101.22)  1907953  (12.40)  158286  (17.70)  226014  (49.91)  182099  (1.76)  566399  (22.02)  361746  (9.96)  18095  (58.21)  379841  (11.58)  2854193  (14.07)  2017  66.85  19.84  13.31  100.00


                 2016  696566  (11.76)  377438  (14.82)  186112  (6.65)  404192  (17.98)  33145  (26.54)  1697453  (13.52)  134484  (34.94)  150767  (48.06)  178952  (-4.81)  464203  (19.19)  328974  (-6.64)  11438  (10.31)  340412  (-6.16)  2502068  (11.33)  2016  67.84  18.55  13.61  100.00


                 2015  623293  (20.14)  328729  (28.68)  174511  (12.57)  342583  (3.88)  26193  (10.04)  1495309  (16.08)  99662  (16.12)  101825  (29.74)  187985  (8.49)  389473  (15.37)  352371  (9.28)  10369  (12.64)  362740  (9.37)  2247522  (14.82) SHARE OF EACH FUND IN TOTAL ASSETS UNDER MANAGEMENT (As on 31st March)  2015  66.53  17.33  16.14  100.00


                 2014  518824  (17.65)  255469  (19.12)  155026  (30.41)  329787  (11.19)  29118  (40.68)  1288225  (15.02)  85826  (20.56)  78481  (52.30)  173272  (8.52)  337579  (19.55)  322456  (0.87)  9205  (46.56)  331661  (3.17)  1957466  (12.18)  2014  65.81  17.25  16.94  100.00


                   Central Govt - Securities  State Govt & Other Approved Securities  Infrastructure  Investments  Approved Investments  Other than Approved (OTAI)  Investments  Total (Life Fund)  Central Govt - Securities  State Govt & Other Approved Securities  Approved Investments  Total (Pension & General Annuity & Group Fund)  Investments  Approved Investments  Other than Approved  Investments (OTAI)  Total (ULIP Funds)  Note: Figures in the brackets indicate the gro


                 Particulars  Life Fund         Pension & General  Annuity Fund  ULIP Funds  GRAND TOTAL  Particulars  Life Fund  Pension & Group Fund  ULIP Fund  TOTAL


                                                           83