
Page 89 - Insurance Statistics 2021
P. 89
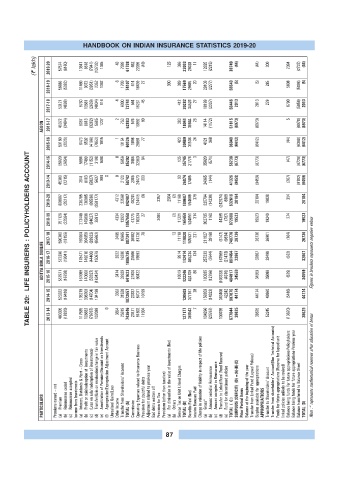
HANDBOOK ON INDIAN INSURANCE STATISTICS 2019-20

             (? lakh)  2019-20  57574  (6160)  13941  8618  (7941)  (13732)  1365  43  7999  61708  462  22099  (49)  125  366  23003  28028  11  12925  (2215)  38749  (44)  (44)  300  2394  (2737)  (44)


                  2018-19  56888  (5082)  11460  9372  (3951)  2352  1362  6  1700  74107  414  16439  27  300  389  17569  29695  20  29106  (2277)  56543  (5)  (5)  285  5608  (5898)  (5)


                  2017-18  53121  (4098)  9760  13681  (2609)  (4034)  916  4  6000  72741  564  19261  45  412  20282  34526  27  18199  (2307)  50446  2013  2013  279  6790  (5056)  2013


                AEGON  2016-17  45072  (3484)  8087  8813  (3202)  5605  1237  2  753  62883  576  16992  90  383  18041  38844  28  14114  (1172)  51815  (6973)  (6973)  5  (6978)  (6973)


                  2015-16  50160  (3029)  6473  6502  (4196)  (7853)  1915  1  10154  60126  1898  28091  77  423  30489  31536  24  4121  368  36049  (6412)  (6412)  (44)  (6368)  (6412)

           TABLE 20:  LIFE INSURERS : POLICYHOLDERS ACCOUNT
                  2014-15  55920  (2654)  5094  17489  (1152)  3190  1660  0  5656  85202  3466  32060  84  135  35745  21778  3  35020  (571)  56230  (6773)  (6773)  (47)  (6726)  (6773)


                  2013-14  45300  (2215)  3841  8103  (5027)  5637  984  0  0  2120  58742  2005  24473  303  93  26874  17405  24065  (144)  41326  (9459)  (9459)  (267)  (9192)  (9459)


                  2019-20  800997  (25217)  236705  130805  (69506)  (258177)  4312  22568  842487  48244  124415  (0)  3357  2504  (2)  11169  189687  554609  378  325764  (14230)  (242574)  8668  632616  20184  20184  19830  354  20184


                  2018-19  751126  (22564)  213440  145606  (84027)  35813  4334  13922  1057650  41775  110034  27  2404  (2)  11221  165459  524851  314  302735  1160  44395  (787)  872668  19523  19523  19249  274  19523


                  2017-18  590300  (18155)  190664  204956  (28922)  (65662)  3495  10665  887341  26882  81736  78  13  11119  119828  505531  231  211827  39168  (6147)  (9834)  740776  26736  26736  26901  (164)  26736
                ADITYA BIRLA SUNLIFE  2016-17  2015-16  572396  557971  (19041)  (16798)  178471  161089  149010  140008  (44400)  (53327)  150678  (183434)  3322  3474  16300  32639  1006735  641623  25506  21806  76993  90422  9914  10019  112414  122246  465234  424709  134  86  257233  180635  (7644)  (12766)  167969  (103328)  (21473)  (4519)  861454  484817  32867  34559  32867  34559  33499  35088  (632)  (529)  32867  34559 Figures in brackets represents negative


                  2014-15  523322  (16486)  135219  306208  (14704)  104198  3362  31538  1072657  23337  87071  10199  120608  377161  28  159359  (14323)  343408  42242  907875  44174  44174  49660  (5486)  44174


                  2013-14  483305  (18820)  117585  106682  (76767)  102088  0  3654  25919  743646  23471  91802  11904  127177  366543  7  104296  (23767)  130765  577844  38625  38625  52245  (13620)  38625


                PARTICULARS  Premiums earned – net  Premium  (a)  Reinsurance ceded  (b)  Reinsurance accepted  (c)  Income from Investments Interest, Dividends & Rent – Gross  (a) Profit on sale/redemption of  investments  (b) (c) (Loss on sale/ redemption of investments) Transfer/Gain on revaluation/change in fair value  (d) Amortization of Premium/Discount on Investments  (e) Appropriation/Expropriation Adjustment Account  (f)  Unrealised Gains/Loss  Other Income Trans


                                                           87