
Page 91 - Insurance Statistics 2021
P. 91
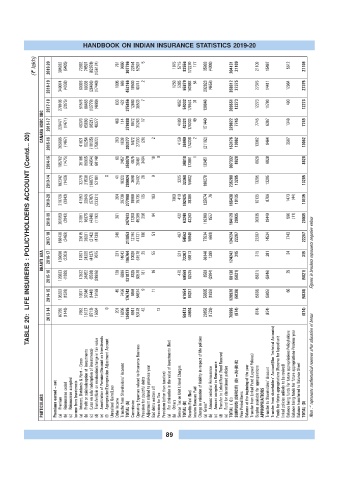
HANDBOOK ON INDIAN INSURANCE STATISTICS 2019-20

             (? lakh)  2019-20  394282  (5405)  72692  74597  (82678)  (156124)  781  9650  307796  22454  52507  5  1875  5715  82556  172270  177  35993  (4309)  204131  21109  21109  15497  5612  21109


                  2018-19  349074  (4038)  60026  89338  (26486)  (17440)  1005  686  452166  18500  40741  2  1250  5385  65879  160693  54  202823  (4658)  358912  27375  27375  14411  12964  27375


                  2017-18  278106  (2875)  51576  66463  (13779)  (4889)  833  422  375856  12640  36533  7  4852  54032  178574  31  130946  309551  12273  12273  11780  493  12273
                CANARA HSBC OBC  2016-17  229471  (1471)  46370  65080  (9521)  49377  468  114  379888  6872  31243  17  4189  42321  178333  49  151440  329822  7745  7745  6397  1348  7745


           TABLE 20:  LIFE INSURERS : POLICYHOLDERS ACCOUNT (Contd... 20)
                  2015-16  205996  (1467)  41021  50254  (18135)  (75822)  293  1038  203177  5472  27333  (26)  2  4159  36940  174336  2  (21162)  153176  13062  13062  9464  3597  13062


                  2014-15  165702  (1475)  39106  89935  (4954)  60148  60  2457  350979  4875  26461  3464  19  0  34818  173881  1  133451  307332  8828  8828  8828  8828


                  2013-14  182342  (1400)  32779  21538  (16877)  52181  0  41  10320  280924  3698  25402  26  9  3225  32360  55002  180278  235280  13285  13285  13285  13285


                  2019-20  218726  (3043)  41553  20946  (5787)  (23331)  204  28730  277998  18960  75736  135  183  7000  410  102425  39388  125974  76  165438  10135  10135  8706  1473  (44)  10135


                  2018-19  207550  (2843)  31891  16075  (4349)  (1192)  281  247413  17200  45288  256  84  422  63249  43263  119309  1557  164129  20035  20035  19449  596  (11)  20035


                  2017-18  168439  (2469)  23615  28091  (2142)  (4730)  249  211053  12194  41731  100  51  487  54562  56949  77934  (660)  134224  22267  22267  14524  7743  22267


                BHARTI AXA  2016-17  139650  (2203)  17801  24205  (4127)  7075  321  14043  196764  10028  61578  25  55  521  72207  56813  66140  1289  124242  315  315  281  34  315 Figures in brackets represents negative values


                  2015-16  120833  (1889)  13532  24852  (3538)  (28926)  128  6886  131877  8325  60576  181  16  470  69569  62535  8589  (2994)  68130  (5821)  (5821)  (5846)  25  (5821)


                  2014-15  105332  (1528)  10371  37346  (1448)  19169  45  7456  176742  6959  54674  9  11  61654  66287  56565  (1926)  120926  (5838)  (5838)  (5905)  66  (5838)


                  2013-14  87265  (1148)  7652  18127  (8713)  15004  0  201  16206  134595  4941  53478  42  13  58473  49864  28858  (1726)  76996  (874)  (874)  (874)  (874)


                PARTICULARS  Premiums earned – net  Premium  (a)   Reinsurance ceded  (b)  Reinsurance accepted  (c)   Income from Investments Interest, Dividends & Rent – Gross  (a)   Profit on sale/redemption of  investments  (b) (c) (Loss on sale/ redemption of investments) Transfer/Gain on revaluation/change in fair value  (d) Amortization of Premium/Discount on Investments  (e) Appropriation/Expropriation Adjustment Account  (f)  Unrealised Gains/Loss  Other Income T


                                                           89