
Page 93 - Insurance Statistics 2021
P. 93
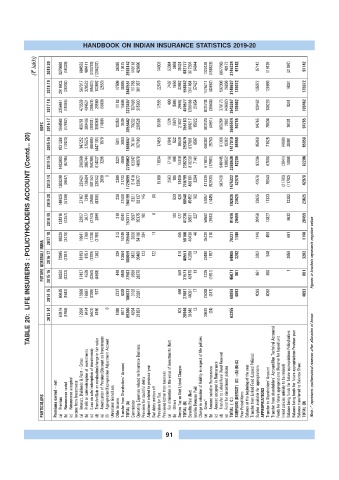
HANDBOOK ON INDIAN INSURANCE STATISTICS 2019-20

              (? lakh)  2019-20  3270689  (48329)  684532  484411  (233793)  (1266237)  24395  10475  2926142  149118  426690  14903  53084  3658  35324  682777  1817304  84844  1322439  (158828)  (967706)  48172  2146224  97142  97142  119139  (21997)  97142


                   2018-19  2918602  (26202)  567917  328523  (95031)  103892  (2553)  17506  30895  3843551  111768  381357  22679  7407  1650  33982  558842  1341464  57427  1175211  (43667)  592306  26896  3149637  135072  135072  120690  14381  135072


                   2017-18  2356441  (19345)  473539  404531  (38578)  25580  (5609)  11182  15665  3223407  107493  315930  17555  490  (584)  29692  470577  1289488  21654  1031738  (38004)  379173  (40682)  2643367  109462  109462  100220  9241  109462


                HDFC  2016-17  1944549  (17062)  406761  389406  (39001)  358366  (1468)  10353  3539  3055442  79202  238528  15198  1224  (597)  21607  355163  984217  15822  803120  (4991)  805264  2082  2605514  94765  94765  78634  16131  94765
           TABLE 20:  LIFE INSURERS : POLICYHOLDERS ACCOUNT (Contd... 20)
                   2015-16  1631298  (13420)  347252  375525  (98494)  (447105)  1879  5911  3800  1806647  70184  187183  17455  (204)  522  18539  293679  817691  6507  486382  25763  61366  19302  1417010  95958  95958  71825  (4868)  29001  95958


                   2014-15  1482990  (6745)  286068  380744  (59208)  614027  3296  3221  4669  2709062  62347  148879  11934  (716)  465  15318  238226  816239  7141  511914  (17961)  940445  130852  2388630  82206  82206  67086  (3841)  18960  82206


                   2013-14  1206290  (8647)  235421  129694  (88152)  228342  2030  0  2388  21733  1729099  51410  128077  15160  2563  188  13400  210799  466191  3294  471339  (52930)  587428  1475322  42978  42978  76540  (21780)  (11782)  42978


                   2019-20  148025  (5139)  27167  7349  (2568)  (8380)  239  27508  194199  5321  62137  145  (0)  520  426  68548  45452  162  57857  (1445)  102026  23625  23625  11333  12292  23625


                   2018-19  124316  (4357)  22857  3677  (2743)  2999  318  6044  153111  5097  35375  100  6  180  477  41236  36531  227  56562  (1903)  91416  20459  20459  13827  6632  20459


                   2017-18  99229  (3478)  19941  7769  (1220)  (3158)  212  16249  135544  3308  54189  204  11  455  58166  40436  46  35439  310  76231  1148  1148  456  691  1148
                FUTURE GENERALI INDIA  2016-17  2015-16  73985  59250  (3197)  (2322)  18153  17437  8751  4538  (1289)  (3350)  1262  (4968)  329  448  10664  6468  108659  77503  3422  2638  36468  28375  123  122  416  558  40551  31571  40250  42475  12  13  23488  4235  1157  (1651)  64906  45071  3202  861  3202  861  546  860  2656  1  3202  861 Figures in brackets represents negative values


                   2014-15  60425  (1642)  15599  18697  (2399)  577  2737  6038  100033  3102  23281  698  27081  44091  17  25068  (317)  68859  4093  4093  4093  4093


                   2013-14  63416  (1959)  12958  8424  (5507)  4190  0  1069  6611  89200  4294  21851  801  26946  31648  12  30619  (24)  62255


                PARTICULARS  Premiums earned – net  Premium  (a)   Reinsurance ceded  (b)    Reinsurance accepted  (c)   Income from Investments Interest, Dividends & Rent – Gross  (a)   Profit on sale/redemption of  investments  (b) (c) (Loss on sale/ redemption of investments) Transfer/Gain on revaluation/change in fair value  (d) Amortization of Premium/Discount on Investments  (e) Appropriation/Expropriation Adjustment Account  (f)  Unrealised Gains/Loss  Other Income


                                                           91