
Page 98 - Insurance Statistics 2021
P. 98
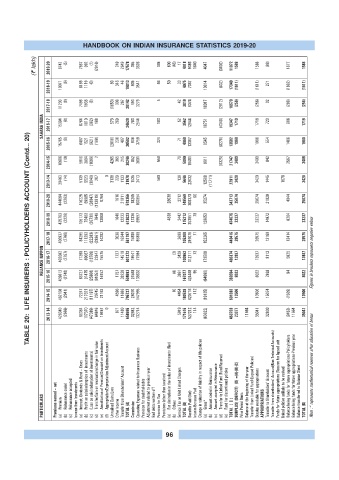
HANDBOOK ON INDIAN INSURANCE STATISTICS 2019-20

             (? lakh)  2019-20  8743  (5)  7867  992  (1)  (2916)  249  2649  17578  355  3626  365  600  (46)  17  4918  9386  1040  4047  (3402)  11072  1588  1588  (89)  1677  1588


                  2018-19  10071  (6)  8189  1119  (0)  80  316  46  19813  405  3541  46  50  33  4075  7367  10814  (832)  17349  (1611)  (1611)  271  (1882)  (1611)


                  2017-18  11203  (8)  7498  1936  (8)  (1053)  308  267  20142  493  3279  5  42  3819  9374  10017  (2812)  16579  (256)  (256)  32  (288)  (256)

                SAHARA INDIA  2016-17  15394  (8)  6764  1810  (362)  188  573  269  24629  783  2544  183  52  3562  12944  10751  (4348)  19347  1719  1719  723  996  1719


           TABLE 20:  LIFE INSURERS : POLICYHOLDERS ACCOUNT (Contd... 20)
                  2015-16  15705  (8)  6487  1521  (921)  (188)  (2810)  230  487  20502  806  3759  324  71  4960  13307  8545  (8270)  13582  1960  1960  554  1406  1960


                  2014-15  16686  (10)  5916  3894  (1086)  2  4265  365  215  30246  852  3601  558  79  5090  19461  8611  (6325)  21747  3409  3409  842  2567  3409


                  2013-14  20463  (14)  5139  5523  (3840)  207  0  3138  229  1133  31978  1535  3413  560  138  5646  22032  12589  (11711)  22911  3420  3420  1445  1976  3420


                  2019-20  444094  (2263)  116225  69985  (28047)  (113019)  8754  1616  21011  518356  18265  100054  28038  3212  149569  308373  66  35274  343713  25074  25074  21029  4044  25074


                  2018-19  435793  (2226)  105173  75483  (36738)  7848  13808  1649  12233  613023  17336  89597  4838  3442  115212  353851  70  120653  474575  23237  23237  14972  8264  23237


                  2017-18  406937  (2768)  84295  111293  (22283)  (28861)  14202  2038  16344  581197  15808  85800  3600  105208  297079  71  152265  449415  26575  26575  13160  13414  26575

                RELIANCE NIPPON  2016-17  402682  (2757)  71390  89067  (13769)  22847  15575  1727  14510  601272  19541  77984  (2)  3439  100962  312711  73  173589  486374  13937  13937  8112  5825  13937 Figures in brackets represents negative values


                  2015-16  439812  (2748)  66727  91475  (25668)  (91052)  16152  1757  38238  534693  24588  138636  (8)  3861  167077  424468  95  (64968)  359594  8022  8022  7928  94  8022


                  2014-15  462108  (2941)  72247  217321  (11197)  20745  21163  4596  11686  795727  28070  147995  10  4454  180529  620716  112  (19135)  601693  13506  13506  15074  (1569)  13506


                  2013-14  428340  (2666)  66384  117370  (47389)  64846  19457  0  871  11480  658695  32982  132714  5919  171615  527212  114  (63622)  463703  23377  11664  35041  32830  (9453)  11664  35041


                PARTICULARS  Premiums earned – net  Premium  (a)   Reinsurance ceded  (b)    Reinsurance accepted  (c)   Income from Investments Interest, Dividends & Rent – Gross  (a)   Profit on sale/redemption of  investments  (b) (Loss on sale/ redemption of investments)  (c) Transfer/Gain on revaluation/change in fair value  (d) Amortization of Premium/Discount on Investments  (e) Appropriation/Expropriation Adjustment Account  (f)  Unrealised Gains/Loss  Other Incom


                                                           96