
Page 101 - Insurance Statistics 2021
P. 101
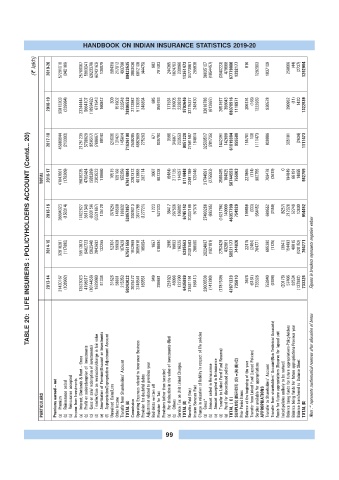
HANDBOOK ON INDIAN INSURANCE STATISTICS 2019-20

             (? lakh)  2019-20  57291019  (340108)  25766067  5983041  (2823378)  (6243163)  136879  (58435)  217912  493700  80423535  3083436  6012100  (44475)  902  791483  244365  1024793  238868  11351472  34773961  285830  36835107  (1054457)  (3540223)  479668  67779886  1292177  816  1292993  1037109  258666  (44)  (2737)  1292994


                  2018-19  50813203  (239964)  23344444  5664107  (1893492)  671643  160842  300  151902  223548  78896533  2773982  5113026  348894  685  859793  171534  210905  223828  9702646  32775377  248430  32618786  (613697)  2651977  396043  68076916  1116971  206134  (166)  1322939  930578  390952  (11)  1420  1322939


           TABLE 20:  LIFE INSURERS : POLICYHOLDERS ACCOUNT (Contd... 20)
                  2017-18  45880944  (213393)  21251235  5798628  (656517)  (780867)  90140  (21008)  131421  145614  71626198  2530205  4882069  275283  671  809790  3586  346071  203553  9051228  27591507  194014  32530517  (281735)  1442391  142690  61619384  955586  155781  106  1111473  809006  305101  (2634)  1111473


                TOTAL  2016-17  41847661  (179309)  19036235  4780484  (568289)  2303523  116660  16515  105168  155356  67614004  2207373  4613888  282114  2007  687328  (9484)  217125  114097  8114448  23491789  120446  31794591  (275593)  3508495  104825  58744553  755003  227865  (114)  982755  709478  (2619)  0  194849  66191  14855  982755


                  2015-16  36694323  (150314)  17422627  3611349  (833156)  (3321697)  135128  (37625)  148590  188632  53857857  2024013  3877789  (127721)  1223  527033  38417  297506  106882  6745142  20337199  97376  27493266  (88265)  (1621796)  140009  46357790  754926  199859  (333)  954452  689552  (2450)  (8257)  212028  52749  10830  954452


                  2014-15  32810201  (117680)  15513073  6462723  (392546)  2843692  132255  52304  59908  187629  57551559  1942969  3685916  105854  1857  410694  2996  19053  116225  6285563  21091503  200580  26224967  (182181)  2753428  432881  50521177  744820  22415  (2464)  764771  695380  (1125)  (3841)  154493  48015  (128152)  764771 Figures in brackets represents negative values


                  2013-14  31430167  (108902)  13523023  4196917  (1014456)  1629080  81334  31626  58881  215353  50043022  2075472  3746541  169551  949  299681  (25102)  46098  122700  6435889  21631191  156413  23006538  (141280)  (1781539)  42871323  735810  3676  (6161)  733326  753940  (2496)  (20176)  57406  82534  (137882)  733326


                PARTICULARS  Premiums earned – net  (a) Premium  Reinsurance ceded  (b)   (c) Reinsurance accepted  Income from Investments Interest, Dividends & Rent – Gross  (a)   Profit on sale/redemption of  investments  (b) (Loss on sale/ redemption of investments)  (c)  Transfer/Gain on revaluation/change in fair value  (d) Amortization of Premium/Discount on Investments  (e) Appropriation/Expropriation Adjustment Account  (f)  Unrealised Gains/Loss  Other Income Tr


                                                           99