
Page 97 - Insurance Statistics 2021
P. 97
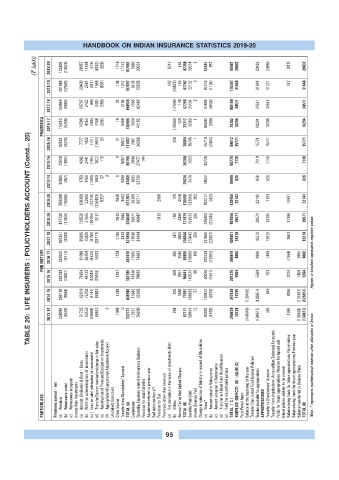
HANDBOOK ON INDIAN INSURANCE STATISTICS 2019-20

              (? lakh)  2019-20  122806  (10076)  28057  11194  (779)  (6182)  (629)  1719  11772  157881  3960  33031  5212  164  42368  39374  2  54848  857  95081  20432  20432  20850  (417)  20432


                   2018-19  181686  (12549)  23430  2584  (311)  1999  (507)  108  1257  197697  8135  53535  402  (14525)  195  47742  32192  3  87219  (1106)  118307  31648  31648  31231  417  31648


                   2017-18  184446  (9869)  16797  2422  (90)  (405)  (558)  31  2164  194938  7066  62463  (17444)  174  52258  25434  2  87669  (4936)  108169  34511  34511  34511  34511


                PRAMERICA  2016-17  114210  (5259)  11596  4153  (304)  1106  (200)  19  5666  130988  2600  41152  (10563)  123  33312  19369  1  60600  (589)  79382  18294  18294  18294  18294

           TABLE 20:  LIFE INSURERS : POLICYHOLDERS ACCOUNT (Contd... 20)
                   2015-16  92021  (3210)  7777  1432  (111)  (1984)  55  11  15677  111667  2461  34298  126  36884  15785  1  45710  (2484)  59012  15771  15771  15771  15771


                   2014-15  73510  (1885)  4242  2441  (165)  1822  115  9  8067  88156  2648  27477  144  30268  7053  43725  50778  7110  7110  7110  7110


                   2013-14  30586  (357)  1750  1458  (1283)  1800  37  0  8  9459  43458  1895  23739  25634  2476  14522  16999  826  826  826  826


                   2019-20  550696  (15886)  128380  52800  (23770)  (126453)  5357  2635  3502  577261  28365  90711  2908  129  4556  126668  233508  302  192217  2423  428450  22143  22143  7193  14951  22143


                   2018-19  477720  (11856)  113520  51565  (10489)  5012  2613  7564  635649  25077  90647  1913  (18)  4309  121928  193633  266  325493  (32343)  487050  26671  26671  15305  11366  26671


                   2017-18  395351  (9300)  95809  75829  (8158)  (28717)  2198  4843  527856  21548  81484  (47)  3859  106844  210843  259  217586  (23887)  404801  16210  16210  13529  2681  16210


                PNB METLIFE  2016-17  323608  (9717)  81086  56754  (5132)  19353  1724  467676  17965  74663  485  3585  96698  176908  168  202534  (12692)  366919  4060  4060  1469  (1364)  3955  4060 Figures in brackets represents negative values


                   2015-16  282783  (10061)  71934  46133  (10342)  (79455)  1287  302280  16146  74933  805  3557  95441  143074  95  60048  (1941)  201275  5564  5564  931  3224  1409  5564


                   2014-15  246119  (9564)  62616  72702  (4147)  66851  1388  435965  13843  60365  205  3268  77681  186826  57  163522  (2876)  347529  10755  (136406)  (125651)  649  9096  (135397)  (125651)


                   2013-14  224059  (6533)  51725  63553  (48004)  46843  0  1095  0  332737  12677  54200  294  67171  160474  12  92028  (1676)  250839  14728  (149345)  (134617)  394  1395  (136406)  (134617)


                PARTICULARS  Premiums earned – net  Premium  (a)   Reinsurance ceded  (b)    Reinsurance accepted  (c)   Income from Investments Interest, Dividends & Rent – Gross  (a)   Profit on sale/redemption of  investments  (b) Loss on sale/ redemption of investments)  (c) ( Transfer/Gain on revaluation/change in fair value  (d) Amortization of Premium/Discount on Investments  (e) Appropriation/Expropriation Adjustment Account  (f)  Unrealised Gains/Loss  Other Inco


                                                           95