
Page 94 - Insurance Statistics 2021
P. 94
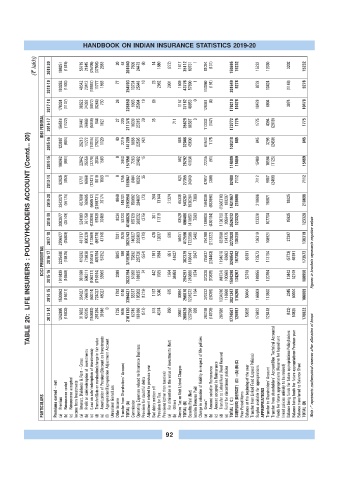
HANDBOOK ON INDIAN INSURANCE STATISTICS 2019-20

              (? lakh)  2019-20  184251  (1615)  56719  21845  (25705)  (37506)  2983  20  48  201040  7609  24473  (8)  14  1680  (272)  1617  35112  69731  1  81094  (131)  150695  15232  15232  12030  3202  15232


                   2018-19  193252  (1403)  48542  20412  (19847)  11777  1893  77  254703  10724  25648  10  23  2962  2901  1509  43776  57890  1  143950  (191)  201649  9278  9278  10424  (1146)  9278


                   2017-18  178324  (1107)  39622  24392  (8872)  (6264)  730  26  226850  9993  25994  19  (0)  1157  37162  49853  0  129361  (4)  179210  10478  10478  6604  3874  10478

                IDBI FEDERAL  2016-17  156519  (1122)  31447  26869  (5049)  844  1621  27  220  211376  10039  25015  29  35  711  35829  60587  0  113332  (147)  173772  1775  1775  4394  (2619)  1775


           TABLE 20:  LIFE INSURERS : POLICYHOLDERS ACCOUNT (Contd... 20)
                   2015-16  123967  (884)  26213  11272  (14815)  (7921)  1120  40  2219  141209  8886  22595  (42)  608  32046  45600  61543  1175  108318  845  845  3295  (2450)  845


                   2014-15  106962  (891)  22042  25556  (3778)  2934  1583  0  3440  157850  7203  20492  15  582  28292  41934  72245  (91)  114089  15469  15469  16594  (1125)  15469


                   2013-14  82625  (853)  17711  16868  (12431)  9610  1663  0  0  1755  116947  8404  18292  35  624  27355  34949  47917  (386)  82480  7112  7112  9607  (2496)  7112


                   2019-20  3343070  (55175)  607688  769695  (506512)  (2198731)  76174  8040  149701  2193950  158602  284687  (73)  264  13144  21324  65339  543287  1930264  7396  1564009  (683690)  (1566310)  180297  1431967  218696  218696  198871  19825  218696


                   2018-19  3092977  (35149)  524383  761750  (433096)  97939  70468  8034  52720  4140026  155129  260532  (375)  361  11318  63520  490486  1418851  7063  1186008  (430104)  1138750  205644  3526212  123328  123328  107704  15625  123328


                   2017-18  2706877  (25809)  481317  800328  (112869)  (89776)  47146  7001  7528  3821743  140327  202993  (170)  478  12007  509  56451  412596  1722586  5492  794708  (212322)  837588  124775  3272828  136319  136319  108921  27397  136319

                ICICI PRUDENTIAL  2016-17  2235400  (19875)  419292  719838  (104581)  405794  57352  5905  180  3719304  75892  235720  (554)  1161  7884  651  41627  362379  1496441  3347  725937  (234463)  1194618  63663  3249543  107382  66191  173573  113154  (5773)  66191  173573 Figures in brackets represents negative values


                   2015-16  1916439  (16569)  381690  508311  (106217)  (716914)  53966  2088  2022794  61998  188835  74  442  7035  1264  34650  294297  1240868  1874  370238  (70635)  (48724)  100668  1594290  134207  52749  186956  120764  13442  52749  186956


                   2014-15  1530662  (14617)  354027  796678  (50314)  724027  48027  1792  4146  3394427  55317  165202  (1219)  1167  5040  675  30694  256876  1224572  1164  370722  (26095)  1334016  116968  3021347  116205  50404  166609  113860  2345  50404  166609


                   2013-14  1242865  (14600)  316932  432015  (150483)  291264  31946  0  1725  9465  2161130  62749  161686  (512)  818  4374  850  30661  260626  1207396  938  293198  (14709)  287685  1774507  125997  50825  176822  126418  (422)  50825  176822


                PARTICULARS  Premiums earned – net  Premium  (a)   Reinsurance ceded  (b)    Reinsurance accepted  (c)   Income from Investments Interest, Dividends & Rent – Gross  (a)   Profit on sale/redemption of  investments  (b) (c) (Loss on sale/ redemption of investments) Transfer/Gain on revaluation/change in fair value  (d) Amortization of Premium/Discount on Investments  (e) Appropriation/Expropriation Adjustment Account  (f)  Unrealised Gains/Loss  Other Income


                                                           92