
Page 92 - Insurance Statistics 2021
P. 92
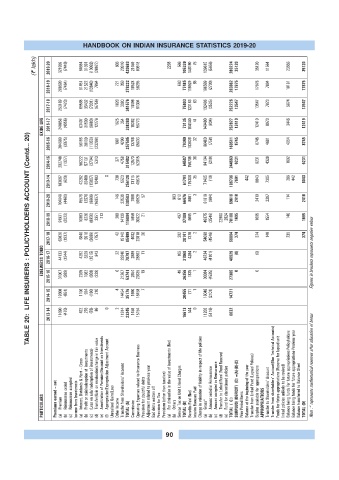
HANDBOOK ON INDIAN INSURANCE STATISTICS 2019-20

             (? lakh)  2019-20  321959  (7449)  94984  31391  (13092)  (28627)  606  20910  420683  21559  80918  2298  566  105339  146190  75  139615  (5656)  280224  35120  35120  11564  23556  35120


                  2018-19  288620  (7464)  81451  21522  (13840)  7864  721  350  379222  18528  58295  663  77485  119929  65  166599  (2730)  283862  17875  17875  7694  10181  17875


                  2017-18  253189  (7423)  69565  35432  (7331)  (6756)  1820  3080  341576  14499  61304  75803  123183  63  132486  (3505)  252226  13547  13547  7873  5674  13547


                EXIDE LIFE  2016-17  240858  (4956)  63407  31500  (6683)  12276  1625  354  338380  16362  56773  73135  104140  41  149480  (834)  252827  12419  12419  8973  3446  12419

           TABLE 20:  LIFE INSURERS : POLICYHOLDERS ACCOUNT (Contd... 20)
                  2015-16  204699  (3075)  56198  28139  (11350)  (23288)  1981  4290  257595  13706  65633  79340  103836  32  66400  (758)  169511  8745  8745  4691  4054  8745


                  2014-15  202748  (1327)  50222  57131  (3734)  5313  371  4758  315482  12573  52015  64587  150709  30  94134  (210)  244663  6231  6231  4329  1902  6231


                  2013-14  183067  (620)  42282  30460  (15807)  10493  0  730  5523  256128  13115  48676  61791  115306  35  71405  (10)  186736  7601  442  8043  7305  296  442  8043


                  2019-20  104848  (4460)  15578  12576  (6666)  (16057)  146  32539  138503  7896  56929  57  983  612  66476  8801  3  61616  (804)  69616  2410  2410  2297  114  2410


                  2018-19  91931  (3023)  10303  8220  (8950)  3351  713  209  14139  116894  5959  30622  21  497  37100  6685  1  49075  (3546)  22960  2924  78100  1695  1695  1554  140  1695


                  2017-18  63826  (1937)  6846  5918  (3669)  (757)  42  15140  85409  4002  23818  20  302  28141  7370  2  54068  (4546)  56894  374  374  140  235  374

                EDELWEISS TOKIO  2016-17  2015-16  44133  31007  (1544)  (989)  4292  2265  3226  1082  (1515)  (658)  843  (239)  22  6  29340  21267  78797  53741  2889  2654  28863  23635  11  19  105  48  31868  26356  4294  1835  2  1  46734  30084  (4101)  (4535)  46929  27385  (0)  0  (0)  0  Figures in brackets represents negative values


                  2014-15  19308  (651)  1106  924  (180)  210  4  14454  35176  1990  18458  7  20455  771  1  16049  (2101)  14721


                  2013-14  11090  (470)  422  276  (76)  86  0  2  11914  23245  1459  15154  16613  544  0  11203  (5116)  6632


                PARTICULARS  Premiums earned – net  Premium  (a)   Reinsurance ceded  (b)    Reinsurance accepted  (c)   Income from Investments Interest, Dividends & Rent – Gross  (a)   Profit on sale/redemption of  investments  (b) (c) (Loss on sale/ redemption of investments) Transfer/Gain on revaluation/change in fair value  (d) Amortization of Premium/Discount on Investments  (e) Appropriation/Expropriation Adjustment Account  (f)  Unrealised Gains/Loss  Other Income


                                                           90