
Page 90 - Insurance Statistics 2021
P. 90
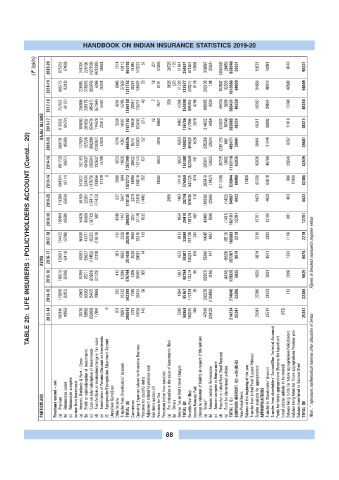
HANDBOOK ON INDIAN INSURANCE STATISTICS 2019-20

             (? lakh)  2019-20  975253  (7403)  241004  224190  (127103)  (420089)  26624  7514  43113  963102  41885  176323  57  231  (2346)  26720  120  11841  254831  671407  13468  316097  (3324)  (368058)  28450  658040  50231  50231  42091  8140  50231


                  2018-19  885716  (5318)  226695  215976  (83076)  6096  25078  8946  37639  1317752  30291  155829  23  18  8101  6626  (32)  11720  212577  533215  9178  282136  198  153507  32333  1010566  94609  94609  48010  46599  94609


                  2017-18  757837  (6107)  206609  295175  (45417)  (57364)  15447  4254  15745  1186180  20317  120757  40  7  1571  309  11398  154398  805355  4794  180385  (809)  (9933)  5639  985431  46350  46350  34954  11396  46350

                BAJAJ ALLIANZ  2016-17  618332  (6122)  194080  261632  (53470)  114628  20413  3504  14187  1167182  14644  105630  (21)  12  6059  9462  135786  617006  2976  214902  6854  124607  16740  983085  48311  48311  36892  11418  48311


           TABLE 20:  LIFE INSURERS : POLICYHOLDERS ACCOUNT (Contd... 20)
                  2015-16  589731  (6560)  177420  197224  (89288)  (228387)  17824  4214  4357  666536  15741  110863  152  4614  9553  140923  499826  1428  235206  (2624)  (249125)  1461  486171  39441  39441  31144  8297  39441


                  2014-15  601730  (6927)  152193  484837  (39561)  132632  15798  5023  11625  1357349  20622  112174  127  8653  9822  151398  823049  741  295611  (5902)  35725  13892  1163116  42835  42835  48789  (5954)  42835


                  2013-14  584314  (6711)  147827  324434  (137970)  139956  17170  0  2998  694  1072712  14896  134610  252  14692  12418  176869  847725  474  295419  (1427)  (311246)  830944  64900  17406  82306  63910  989  17406  82306


                  2019-20  119364  (5859)  56769  32561  (15411)  (77473)  537  7647  118135  2373  23426  (1445)  2898  1463  28714  109038  116  (19839)  (2866)  (1452)  84997  4423  4423  4020  403  4423


                  2018-19  126494  (5500)  54428  42889  (19713)  302  4249  1147  204297  2051  24178  1532  1654  29414  118174  402  43400  1586  (1461)  162101  12781  12781  12180  601  12781


                  2017-18  134422  (5290)  50408  42471  (9025)  (12819)  412  2339  202916  3659  28310  113  1813  33894  161139  244  10045  1887  (6513)  166803  2219  2219  2393  (174)  2219


                AVIVA  2016-17  133651  (5413)  48281  53927  (11452)  22120  361  9963  251438  3528  29033  74  1673  34307  160231  109  55399  147  (8629)  207257  9874  9874  8541  1333  9874 Figures in brackets represents negative values

                  2015-16  149315  (5296)  47859  25211  (20863)  (31279)  412  10386  175744  4205  34590  302  1697  40794  174219  95  (39357)  (816)  (4816)  129325  5625  5625  5923  (299)  5625


                  2014-15  179625  (5387)  43503  83083  (5407)  20989  262  25730  342399  7780  35434  58  1894  45167  177378  75  203279  (105886)  274846  22386  22386  21673  713  22386


                  2013-14  187810  (4855)  38736  56559  (32663)  17804  0  201  26951  290543  7781  40756  143  2289  50968  192075  340  47919  (26100)  214234  25341  25341  25714  (372)  25341


                PARTICULARS  Premiums earned – net  Premium  (a)   Reinsurance ceded  (b)  Reinsurance accepted  (c)   Income from Investments Interest, Dividends & Rent – Gross  (a)   Profit on sale/redemption of  investments  (b) (c) (Loss on sale/ redemption of investments) Transfer/Gain on revaluation/change in fair value  (d) Amortization of Premium/Discount on Investments  (e) Appropriation/Expropriation Adjustment Account  (f)  Unrealised Gains/Loss  Other Income T


                                                           88