
Page 95 - Insurance Statistics 2021
P. 95
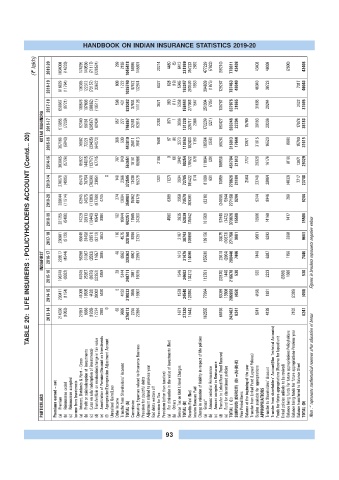
HANDBOOK ON INDIAN INSURANCE STATISTICS 2019-20

             (? lakh)  2019-20  1034008  (14233)  174295  140530  (71117)  (220524)  299  2159  1045418  54995  145901  20214  4480  (5)  6413  231999  357223  2692  477229  (7923)  (59210)  770011  43408  43408  46008  (2600)  43408


                  2018-19  816829  (11764)  136365  122312  (73157)  33622  809  1722  1026740  47472  132974  6027  828  (19)  5965  193247  293570  1953  364639  (1975)  129267  787453  46040  46040  38723  7317  46040


                  2017-18  659867  (8721)  108876  107603  (30062)  (10511)  598  431  828082  37934  111126  3671  363  (11)  5358  158441  277093  1547  251304  (735)  108767  637976  31665  31665  29244  2422  31665
                KOTAK MAHINDRA  2016-17  513955  (7209)  92140  96181  (29567)  80434  657  277  746867  32481  92818  2208  (87)  1  3806  131228  228717  2084  172239  (221)  190427  593246  22394  15790  38183  20306  17878  38183


           TABLE 20:  LIFE INSURERS : POLICYHOLDERS ACCOUNT (Contd... 20)
                  2015-16  397168  (5840)  76882  72221  (33435)  (64073)  366  530  443819  25811  79413  1588  87  (8)  3273  110163  182403  1190  139594  (350)  (6826)  316013  17644  13971  31615  16523  (698)  15790  31615


                  2014-15  303805  (5726)  65922  144015  (13717)  67715  797  840  563651  18161  66906  2186  0  60  2942  90254  178522  878  111864  (29)  160550  451784  21613  7717  29329  16176  (818)  13971  29329


                  2013-14  270079  (4985)  65478  76754  (70296)  33051  0  148  2366  372595  13438  55279  1201  (127)  2994  72785  185422  614  81899  631  10059  278626  21184  2564  23748  20064  (4033)  7717  23748


                  2019-20  336044  (11514)  82945  34575  (11383)  (87789)  4745  274  12084  359981  15062  49179  6388  2950  73579  309391  (3219)  (34858)  5844  277158  9244  9244  8946  298  9244


                  2018-19  321255  (5480)  74229  33913  (10440)  10543  8004  182  10044  442251  11505  34200  4500  2635  52839  135842  181508  57948  (1472)  373826  15586  15586  14169  1417  15586


                  2017-18  230901  (5129)  66649  31458  (3851)  (8212)  3653  116  4575  320160  9386  27251  2107  38743  109898  139156  33075  (10373)  271756  9661  9661  6293  3368  9661


                INDIAFIRST  2016-17  226517  (4544)  56250  31367  (2592)  11657  3695  48  6962  329362  6907  22957  1613  31476  114090  155638  23616  (2904)  290440  7446  7446  6287  1158  7446 Figures in brackets represents negative values


                  2015-16  196740  (3032)  47645  25357  (3670)  (32352)  4859  20  5144  240711  3981  19075  1546  24602  134212  112791  (32870)  1445  215578  530  530  2233  (3389)  1686  530


                  2014-15  203411  (1154)  41009  18505  (428)  39002  5490  5  4192  310032  3655  19307  1578  24540  129380  77964  63099  15508  285950  (458)  (458)  1931  (2389)  (458)


                  2013-14  214336  (1053)  27651  6986  (1936)  17274  2993  0  63  9699  276013  2755  22894  1671  27320  15442  162555  64456  242452  6241  6241  4139  2102  6241


                PARTICULARS  Premiums earned – net  Premium  (a)   Reinsurance ceded  (b)    Reinsurance accepted  (c)   Income from Investments Interest, Dividends & Rent – Gross  (a)   Profit on sale/redemption of  investments  (b) (c) (Loss on sale/ redemption of investments) Transfer/Gain on revaluation/change in fair value  (d) Amortization of Premium/Discount on Investments  (e) Appropriation/Expropriation Adjustment Account  (f)  Unrealised Gains/Loss  Other Income


                                                           93