
Page 55 - Banking Finance September 2022
P. 55
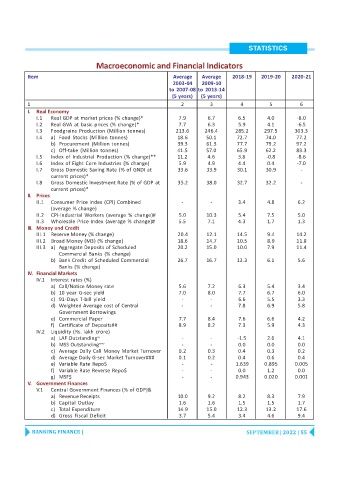
STATISTICS


                                   Macroeconomic and Financial Indicators

           Item                                               Average   Average    2018-19   2019-20   2020-21
                                                              2003-04   2009-10
                                                            to  2007-08 to 2013-14
                                                             (5 years)  (5 years)
           1                                                     2         3          4         5         6
           I.  Real Economy
              I.1  Real GDP at market prices (% change)*        7.9       6.7        6.5       4.0       -8.0
              I.2  Real GVA at basic prices (% change)*         7.7       6.3        5.9       4.1       -6.5
              I.3  Foodgrains  Production (Million tonnes)     213.6     246.4      285.2     297.5      303.3
              I.4  a) Food Stocks (Million tonnes)             18.6       50.1      72.7      74.0       77.2
                   b) Procurement (Million tonnes)             39.3       61.3      77.7      79.2       97.2
                   c) Off-take (Million tonnes)                41.5       57.0      65.9      62.2       83.3
              I.5  Index  of Industrial Production (% change)**  11.2     4.6        3.8       -0.8      -8.6
              I.6  Index of Eight Core Industries (% change)    5.9       4.9        4.4       0.4       -7.0
              I.7  Gross Domestic Saving Rate (% of GNDI at    33.6       33.9      30.1      30.9         -
                   current prices)*
              I.8  Gross Domestic Investment Rate (% of GDP at  35.2      38.0      32.7      32.2         -
                   current prices)*
           II. Prices
              II.1  Consumer Price Index (CPI) Combined          -         -         3.4       4.8        6.2
                   (average % change)
              II.2  CPI-Industrial Workers  (average % change)#  5.0      10.3       5.4       7.5        5.0
              II.3  Wholesale Price Index (average % change)#   5.5       7.1        4.3       1.7        1.3
           III. Money and Credit
              III.1 Reserve Money (% change)                   20.4       12.1      14.5       9.4       14.2
              III.2 Broad Money (M3) (% change)                18.6       14.7      10.5       8.9       11.8
              III.3 a) Aggregate Deposits of Scheduled         20.2       15.0      10.0       7.9       11.4
                      Commercial Banks  (% change)
                   b) Bank Credit of Scheduled Commercial      26.7       16.7      13.3       6.1        5.6
                      Banks (% change)
           IV. Financial Markets
              IV.1  Interest rates (%)
                   a) Call/Notice Money rate                    5.6       7.2        6.3       5.4        3.4
                   b) 10 year G-sec yield                       7.0       8.0        7.7       6.7        6.0
                   c) 91-Days T-bill yield                       -         -         6.6       5.5        3.3
                   d) Weighted Average cost of Central           -         -         7.8       6.9        5.8
                      Government Borrowings
                   e) Commercial Paper                          7.7       8.4        7.6       6.6        4.2
                   f) Certificate of Deposits##                 8.9       8.2        7.3       5.9        4.3
              IV.2  Liquidity (Rs. lakh crore)
                   a) LAF Outstanding~                           -         -        -1.5       2.6        4.1
                   b) MSS Outstanding~~                          -         -         0.0       0.0        0.0
                   c) Average Daily Call Money Market  Turnover  0.2      0.3        0.4       0.3        0.2
                   d) Average Daily G-sec Market Turnover###    0.1       0.2        0.4       0.6        0.4
                   e) Variable Rate Repo$                        -         -        1.639     0.895      0.005
                   f) Variable Rate Reverse Repo$                -         -         0.0       1.2        0.0
                   g) MSF$                                       -         -        0.943     0.020      0.001
           V. Government Finances
              V.1  Central Government Finances (% of GDP)&
                   a) Revenue Receipts                         10.0       9.2        8.2       8.3        7.9
                   b) Capital Outlay                            1.6       1.6        1.5       1.5        1.7
                   c) Total Expenditure                        14.9       15.0      12.3      13.2       17.6
                   d) Gross  Fiscal Deficit                     3.7       5.4        3.4       4.6        9.4

            BANKING FINANCE |                                                           SEPTEMBER | 2022 | 55