
Page 56 - Banking Finance September 2022
P. 56
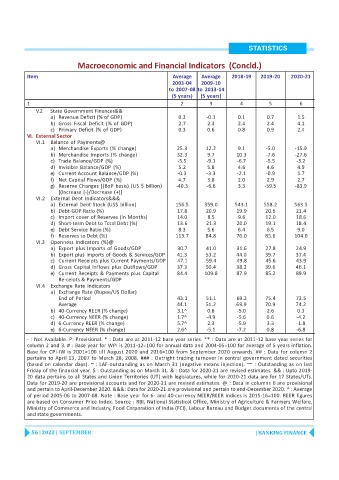
STATISTICS


                            Macroeconomic and Financial Indicators  (Concld.)
           Item                                               Average   Average   2018-19    2019-20   2020-21
                                                              2003-04   2009-10
                                                            to  2007-08 to 2013-14
                                                             (5 years)  (5 years)
           1                                                     2         3         4          5         6
              V.2  State Government Finances&&
                   a) Revenue Deficit (% of GDP)                0.3       -0.1       0.1       0.7       1.5
                   b) Gross Fiscal Deficit (% of GDP)           2.7       2.3        2.4       2.4       4.1
                   c) Primary Deficit  (% of GDP)               0.3       0.6        0.8       0.9       2.4
           VI. External Sector
              VI.1  Balance of Payments@
                   a) Merchandise Exports (% change)           25.3      12.2        9.1      -5.0       -15.9
                   b) Merchandise Imports (% change)           32.3       9.7       10.3      -7.6       -27.6
                   c) Trade Balance/GDP (%)                    -5.5       -9.1      -6.7      -5.5       -3.2
                   d) Invisible Balance/GDP (%)                 5.2       5.8        4.6       4.6       4.9
                   e) Current Account Balance/GDP (%)          -0.3       -3.3      -2.1      -0.9       1.7
                   f) Net Capital Flows/GDP (%)                 4.7       3.8        2.0       2.9       2.7
                   g) Reserve Changes [(BoP basis)  (US $  billion)  -40.3  -6.6     3.3      -59.5      -83.9
                      [(Increase (-)/Decrease (+)]
              VI.2  External Debt Indicators&&&
                   a) External Debt Stock (US$  billion)       156.5     359.0      543.1     558.2     563.5
                   b) Debt-GDP Ratio (%)                       17.8      20.9       19.9      20.6       21.4
                   c) Import cover of Reserves (in Months)     14.0       8.5        9.6      12.0       18.6
                   d) Short-term Debt to Total Debt (%)        13.6      21.3       20.0      19.1       18.4
                   e) Debt Service Ratio (%)                    8.3       5.6        6.4       6.5       9.0
                   f) Reserves to Debt (%)                     113.7     84.8       76.0      85.6      104.0
              VI.3  Openness Indicators  (%)@
                   a) Export plus Imports of Goods/GDP         30.7      41.0       31.6      27.8       24.9
                   b) Export plus Imports of Goods & Services/GDP  41.3  53.2       44.0      39.7       37.4
                   c) Current Receipts plus Current Payments/GDP  47.1   59.4       49.8      45.6       43.9
                   d) Gross Capital Inflows  plus  Outflows/GDP  37.3    50.4       38.2      39.6       46.1
                   e) Current Receipts  & Payments plus  Capital  84.4   109.8      87.9      85.2       89.9
                      Re-ceipts & Payments/GDP
              VI.4  Exchange Rate Indicators
                   a) Exchange Rate (Rupee/US Dollar)
                      End of Period                            43.1      51.1       69.2      75.4       73.5
                      Average                                  44.1      51.2       69.9      70.9       74.2
                   b) 40-Currency REER (% change)              3.1^       0.8       -5.0       2.6       0.3
                   c) 40-Currency NEER (% change)              1.7^       -4.9      -5.6       0.6       -4.2
                   d) 6-Currency REER (% change)               5.7^       2.3       -5.9       3.3       -1.8
                   e) 6-Currency NEER (% change)               2.6^       -5.1      -7.2       0.8       -6.8
           - : Not Available. P: Provisional. * : Data are at 2011-12 base year series. ** : Data are at 2011-12 base year series for
           column 2 and 3. # : Base year for WPI is 2011-12=100 for annual data and 2004-05=100 for average of 5 years inflation.
           Base for CPI-IW is  2001=100 till August 2020  and 2016=100 from  September 2020  onwards. ## : Data for column 2
           pertains  to April 13,  2007  to March 28, 2008.  ### : Outright trading  turnover in central government dated securities
           (based on calendar days). ~ : LAF outstanding as on March 31 (negative  means injection). ~~ : Outstanding  as on last
           Friday of the financial year. $ : Outstanding as on March 31. & : Data for 2020-21 are revised estimates. && : Upto 2019-
           20  data pertains  to all States and Union Territories  (UT) with legislatures, while for 2020-21 data are for 17 States/UTs.
           Data for 2019-20 are provisional accounts and for 2020-21 are revised estimates. @ : Data in columns 6 are provisional
           and pertain to April-December 2020. &&&: Data for 2020-21 are provisional and pertain to end-December 2020. ^ : Average
           of period 2005-06 to 2007-08. Note : Base year for 6- and 40-currency NEER/REER indices is 2015-16=100. REER figures
           are based on Consumer Price Index. Source : RBI, National Statistical Office, Ministry of Agriculture & Farmers Welfare,
           Ministry of Commerce and Industry, Food Corporation of India (FCI), Labour Bureau and Budget documents of the central
           and state governments.


            56 | 2022 | SEPTEMBER                                                          | BANKING FINANCE