
Page 23 - bhp_test_report
P. 23
1 Strategic Report
Capital management KPIs
These KPIs are used as direct
and indirect measures in the
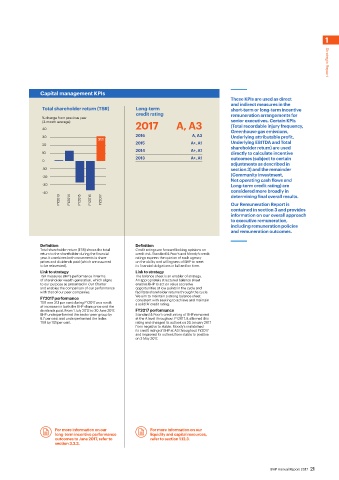
Total shareholder return (TSR) Long-term short-term or long-term incentive
credit rating remuneration arrangements for
% change from previous year senior executives. Certain KPIs
(3-month average) 2017 A, A3 (Total recordable injury frequency,
40 Greenhouse gas emissions,
30 2016 A, A3 Underlying attributable profit,
31.1 Underlying EBITDA and Total
20 2015 A+, A1 shareholder return) are used
2014 A+, A1
10 directly to calculate incentive
2013 A+, A1 outcomes (subject to certain
0
adjustments as described in
-10 section 3) and the remainder
-20 (Community investment,
Net operating cash flows and
-30 Long-term credit rating) are
-40 considered more broadly in
determining final overall results.
FY2013 FY2014 FY2015 FY2016 FY2017 Our Remuneration Report is
contained in section 3 and provides
information on our overall approach
to executive remuneration,
including remuneration policies
and remuneration outcomes.
Definition Definition
Total shareholder return (TSR) shows the total Credit ratings are forward looking opinions on
return to the shareholder during the financial credit risk. Standard & Poor’s and Moody’s credit
year. It combines both movements in share ratings express the opinion of each agency
prices and dividends paid (which are assumed on the ability and willingness of BHP to meet
to be reinvested). its financial obligations in full and on time.
Link to strategy Link to strategy
TSR measures BHP’s performance in terms The balance sheet is an enabler of strategy.
of shareholder wealth generation, which aligns An appropriately structured balance sheet
to our purpose as presented in Our Charter enables BHP to act on value accretive
and enables the comparison of our performance opportunities at low points in the cycle and
with that of our peer companies. facilitate shareholder returns through the cycle.
FY2017 performance We aim to maintain a strong balance sheet
consistent with seeking to achieve and maintain
TSR was 31.1 per cent during FY2017 as a result a solid ‘A’ credit rating.
of increases in both the BHP share price and the
dividends paid. From 1 July 2012 to 30 June 2017, FY2017 performance
BHP underperformed the sector peer group by Standard & Poor’s credit rating of BHP remained
8.7 per cent and underperformed the Index at the A level throughout FY2017. It affirmed this
TSR by 101 per cent. rating and changed its outlook on 20 January 2017
from negative to stable. Moody’s maintained
its credit rating of BHP at A3 throughout FY2017
and improved its outlook from stable to positive
on 3 May 2017.
For more information on our For more information on our
long-term incentive performance liquidity and capital resources,
outcomes to June 2017, refer to refer to section 1.12.3.
section 3.3.3.
BHP Annual Report 2017 21