
Page 127 - Libro 2
P. 127
7 — Intracranial Cerebrovascular Examination
107
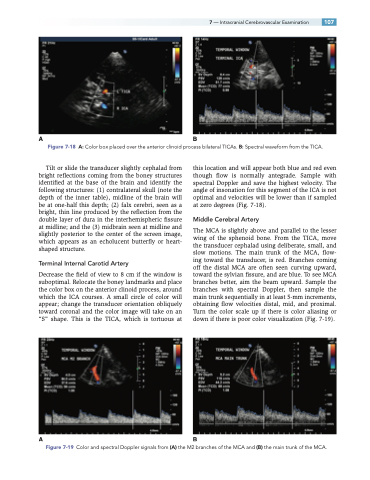
AB
Figure 7-18 A: Color box placed over the anterior clinoid process bilateral TICAs. B: Spectral waveform from the TICA.
Tilt or slide the transducer slightly cephalad from bright reflections coming from the boney structures identified at the base of the brain and identify the following structures: (1) contralateral skull (note the depth of the inner table), midline of the brain will be at one-half this depth; (2) falx cerebri, seen as a bright, thin line produced by the reflection from the double layer of dura in the interhemispheric fissure at midline; and the (3) midbrain seen at midline and slightly posterior to the center of the screen image, which appears as an echolucent butterfly or heart- shaped structure.
Terminal Internal Carotid Artery
Decrease the field of view to 8 cm if the window is suboptimal. Relocate the boney landmarks and place the color box on the anterior clinoid process, around which the ICA courses. A small circle of color will appear; change the transducer orientation obliquely toward coronal and the color image will take on an “S” shape. This is the TICA, which is tortuous at
this location and will appear both blue and red even though flow is normally antegrade. Sample with spectral Doppler and save the highest velocity. The angle of insonation for this segment of the ICA is not optimal and velocities will be lower than if sampled at zero degrees (Fig. 7-18).
Middle Cerebral Artery
The MCA is slightly above and parallel to the lesser wing of the sphenoid bone. From the TICA, move the transducer cephalad using deliberate, small, and slow motions. The main trunk of the MCA, flow- ing toward the transducer, is red. Branches coming off the distal MCA are often seen curving upward, toward the sylvian fissure, and are blue. To see MCA branches better, aim the beam upward. Sample the branches with spectral Doppler, then sample the main trunk sequentially in at least 5-mm increments, obtaining flow velocities distal, mid, and proximal. Turn the color scale up if there is color aliasing or down if there is poor color visualization (Fig. 7-19).
AB
Figure 7-19 Color and spectral Doppler signals from (A) the M2 branches of the MCA and (B) the main trunk of the MCA.
