
Page 169 - Libro 2
P. 169
9 — Duplex Ultrasound of Lower Extremity Arteries 149
TABLE 9-1
Duplex Ultrasound Mean Arterial Diameters and Peak Systolic Velocities (PSVs)
Artery Diameter SD (cm) PSV SD (cm/s)
External iliac
Common femoral
Superficial femoral
(proximal) Superficial
femoral
(distal) Popliteal
119 22 114 25
0.79 0.13 0.82 0.14
0.60 0.12
0.54 0.11
0.520.11 6914
COLOR FLOW IMAGING
Normal color flow imaging will completely fill the vessels. With proper equipment settings of gain and scale, the color will appear uniform and be limited to just the lumen. In areas of disease, color aliasing will be apparent, the color flow channel within the lumen will be reduced, and a color bruit may be present within the surrounding tissue.
SPECTRAL ANALYSIS
Although the color and grayscale images are impor- tant, the PSV is the primary measurement obtained during DA that is used to determine the degree of stenosis. Table 9-1 lists values for normal veloci- ties within the lower extremity vessels. There are some variations observed in PSV; therefore, the Vr is used for grading the stenosis. A PSV Vr 2 reflects
Figure 9-16 Power Doppler image of a small (13.1 mm), behind-the-knee popliteal artery aneurysm with mural throm- bus by the near wall (thrombus thickness is measured 6.6 mm).
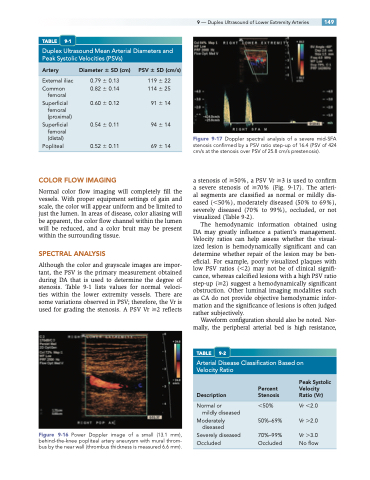
Figure 9-17 Doppler spectral analysis of a severe mid-SFA stenosis confirmed by a PSV ratio step-up of 16.4 (PSV of 424 cm/s at the stenosis over PSV of 25.8 cm/s prestenosis).
a stenosis of 50%, a PSV Vr 3 is used to confirm a severe stenosis of 70% (Fig. 9-17). The arteri- al segments are classified as normal or mildly dis- eased (50%), moderately diseased (50% to 69%), severely diseased (70% to 99%), occluded, or not visualized (Table 9-2).
The hemodynamic information obtained using DA may greatly influence a patient’s management. Velocity ratios can help assess whether the visual- ized lesion is hemodynamically significant and can determine whether repair of the lesion may be ben- eficial. For example, poorly visualized plaques with low PSV ratios (2) may not be of clinical signifi- cance, whereas calcified lesions with a high PSV ratio step-up (2) suggest a hemodynamically significant obstruction. Other luminal imaging modalities such as CA do not provide objective hemodynamic infor- mation and the significance of lesions is often judged rather subjectively.
Waveform configuration should also be noted. Nor- mally, the peripheral arterial bed is high resistance,
TABLE 9-2
Arterial Disease Classification Based on Velocity Ratio
91 14 94 14
Peak Systolic Percent Velocity
Description Stenosis Ratio(Vr)
Normal or 50% Vr 2.0 mildly diseased
Moderately 50%–69% Vr 2.0 diseased
Severely diseased 70%–99% Vr 3.0 Occluded Occluded Noflow
