
Page 337 - Libro 2
P. 337
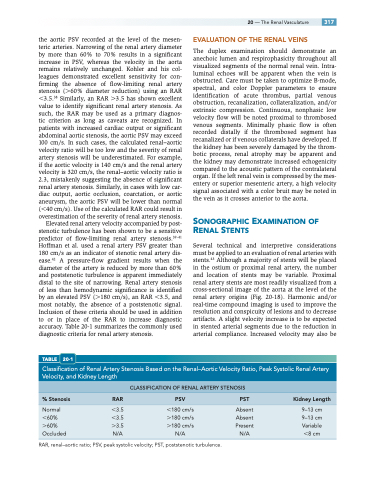
the aortic PSV recorded at the level of the mesen- teric arteries. Narrowing of the renal artery diameter by more than 60% to 70% results in a significant increase in PSV, whereas the velocity in the aorta remains relatively unchanged. Kohler and his col- leagues demonstrated excellent sensitivity for con- firming the absence of flow-limiting renal artery stenosis (60% diameter reduction) using an RAR 3.5.38 Similarly, an RAR 3.5 has shown excellent value to identify significant renal artery stenosis. As such, the RAR may be used as a primary diagnos- tic criterion as long as caveats are recognized. In patients with increased cardiac output or significant abdominal aortic stenosis, the aortic PSV may exceed 100 cm/s. In such cases, the calculated renal–aortic velocity ratio will be too low and the severity of renal artery stenosis will be underestimated. For example, if the aortic velocity is 140 cm/s and the renal artery velocity is 320 cm/s, the renal–aortic velocity ratio is 2.3, mistakenly suggesting the absence of significant renal artery stenosis. Similarly, in cases with low car- diac output, aortic occlusion, coarctation, or aortic aneurysm, the aortic PSV will be lower than normal (40 cm/s). Use of the calculated RAR could result in overestimation of the severity of renal artery stenosis.
Elevated renal artery velocity accompanied by post- stenotic turbulence has been shown to be a sensitive predictor of flow-limiting renal artery stenosis.39–41 Hoffman et al. used a renal artery PSV greater than 180 cm/s as an indicator of stenotic renal artery dis- ease.42 A pressure-flow gradient results when the diameter of the artery is reduced by more than 60% and poststenotic turbulence is apparent immediately distal to the site of narrowing. Renal artery stenosis of less than hemodynamic significance is identified by an elevated PSV (180 cm/s), an RAR 3.5, and most notably, the absence of a poststenotic signal. Inclusion of these criteria should be used in addition to or in place of the RAR to increase diagnostic accuracy. Table 20-1 summarizes the commonly used diagnostic criteria for renal artery stenosis.
TABLE 20-1
20 — The Renal Vasculature 317 EVALUATION OF THE RENAL VEINS
The duplex examination should demonstrate an anechoic lumen and respirophasicity throughout all visualized segments of the normal renal vein. Intra- luminal echoes will be apparent when the vein is obstructed. Care must be taken to optimize B-mode, spectral, and color Doppler parameters to ensure identification of acute thrombus, partial venous obstruction, recanalization, collateralization, and/or extrinsic compression. Continuous, nonphasic low velocity flow will be noted proximal to thrombosed venous segments. Minimally phasic flow is often recorded distally if the thrombosed segment has recanalized or if venous collaterals have developed. If the kidney has been severely damaged by the throm- botic process, renal atrophy may be apparent and the kidney may demonstrate increased echogenicity compared to the acoustic pattern of the contralateral organ. If the left renal vein is compressed by the mes- entery or superior mesenteric artery, a high velocity signal associated with a color bruit may be noted in the vein as it crosses anterior to the aorta.
SONOGRAPHIC EXAMINATION OF RENAL STENTS
Several technical and interpretive considerations must be applied to an evaluation of renal arteries with stents.43 Although a majority of stents will be placed in the ostium or proximal renal artery, the number and location of stents may be variable. Proximal renal artery stents are most readily visualized from a cross-sectional image of the aorta at the level of the renal artery origins (Fig. 20-18). Harmonic and/or real-time compound imaging is used to improve the resolution and conspicuity of lesions and to decrease artifacts. A slight velocity increase is to be expected in stented arterial segments due to the reduction in arterial compliance. Increased velocity may also be
Classification of Renal Artery Stenosis Based on the Renal–Aortic Velocity Ratio, Peak Systolic Renal Artery Velocity, and Kidney Length
CLASSIFICATION OF RENAL ARTERY STENOSIS
% Stenosis
Normal
60%
60%
Occluded N/A N/A N/A 8 cm
RAR PSV
PST
Kidney Length
3.5 180 cm/s 3.5 180 cm/s 3.5 180 cm/s
Absent Absent Present
9–13 cm 9–13 cm Variable
RAR, renal–aortic ratio; PSV, peak systolic velocity; PST, poststenotic turbulence.
