
Page 336 - Libro 2
P. 336
316
PART 5 — ABDOMINAL
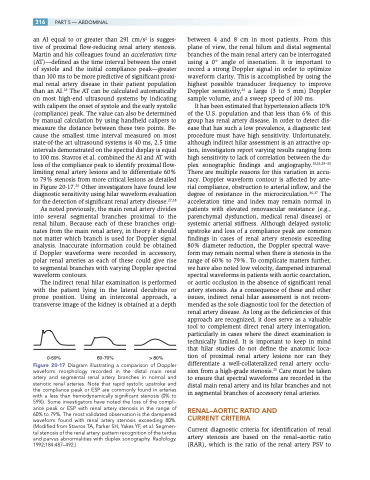
an AI equal to or greater than 291 cm/s2 is sugges- tive of proximal flow-reducing renal artery stenosis. Martin and his colleagues found an acceleration time (AT)—defined as the time interval between the onset of systole and the initial compliance peak—greater than 100 ms to be more predictive of significant proxi- mal renal artery disease in their patient population than an AI.25 The AT can be calculated automatically on most high-end ultrasound systems by indicating with calipers the onset of systole and the early systolic (compliance) peak. The value can also be determined by manual calculation by using handheld calipers to measure the distance between these two points. Be- cause the smallest time interval measured on most state-of-the art ultrasound systems is 40 ms, 2.5 time intervals demonstrated on the spectral display is equal to 100 ms. Stavros et al. combined the AI and AT with loss of the compliance peak to identify proximal flow- limiting renal artery lesions and to differentiate 60% to 79% stenosis from more critical lesions as detailed in Figure 20-17.26 Other investigators have found low diagnostic sensitivity using hilar waveform evaluation for the detection of significant renal artery disease.27,28
As noted previously, the main renal artery divides into several segmental branches proximal to the renal hilum. Because each of these branches origi- nates from the main renal artery, in theory it should not matter which branch is used for Doppler signal analysis. Inaccurate information could be obtained if Doppler waveforms were recorded in accessory, polar renal arteries as each of these could give rise to segmental branches with varying Doppler spectral waveform contours.
The indirect renal hilar examination is performed with the patient lying in the lateral decubitus or prone position. Using an intercostal approach, a transverse image of the kidney is obtained at a depth
between 4 and 8 cm in most patients. From this plane of view, the renal hilum and distal segmental branches of the main renal artery can be interrogated using a 0° angle of insonation. It is important to record a strong Doppler signal in order to optimize waveform clarity. This is accomplished by using the highest possible transducer frequency to improve Doppler sensitivity,26 a large (3 to 5 mm) Doppler sample volume, and a sweep speed of 100 ms.
It has been estimated that hypertension affects 10% of the U.S. population and that less than 6% of this group has renal artery disease. In order to detect dis- ease that has such a low prevalence, a diagnostic test procedure must have high sensitivity. Unfortunately, although indirect hilar assessment is an attractive op- tion, investigators report varying results ranging from high sensitivity to lack of correlation between the du- plex sonographic findings and angiography.10,26,29–35 There are multiple reasons for this variation in accu- racy. Doppler waveform contour is affected by arte- rial compliance, obstruction to arterial inflow, and the degree of resistance in the microcirculation.36,37 The acceleration time and index may remain normal in patients with elevated renovascular resistance (e.g., parenchymal dysfunction, medical renal disease) or systemic arterial stiffness. Although delayed systolic upstroke and loss of a compliance peak are common findings in cases of renal artery stenosis exceeding 80% diameter reduction, the Doppler spectral wave- form may remain normal when there is stenosis in the range of 60% to 79%. To complicate matters further, we have also noted low velocity, dampened intrarenal spectral waveforms in patients with aortic coarctation, or aortic occlusion in the absence of significant renal artery stenosis. As a consequence of these and other issues, indirect renal hilar assessment is not recom- mended as the sole diagnostic tool for the detection of renal artery disease. As long as the deficiencies of this approach are recognized, it does serve as a valuable tool to complement direct renal artery interrogation, particularly in cases where the direct examination is technically limited. It is important to keep in mind that hilar studies do not define the anatomic loca- tion of proximal renal artery lesions nor can they differentiate a well-collateralized renal artery occlu- sion from a high-grade stenosis.25 Care must be taken to ensure that spectral waveforms are recorded in the distal main renal artery and its hilar branches and not in segmental branches of accessory renal arteries.
RENAL–AORTIC RATIO AND CURRENT CRITERIA
Current diagnostic criteria for identification of renal artery stenosis are based on the renal–aortic ratio (RAR), which is the ratio of the renal artery PSV to
0-59% 60-70%
> 80%
Figure 20-17 Diagram illustrating a comparison of Doppler waveform morphology recorded in the distal main renal artery and segmental renal artery branches in normal and stenotic renal arteries. Note that rapid systolic upstroke and the compliance peak or ESP are commonly found in arteries with a less than hemodynamically significant stenosis (0% to 59%). Some investigators have noted the loss of the compli- ance peak or ESP with renal artery stenosis in the range of 60% to 79%. The most validated observation is the dampened waveform found with renal artery stenosis exceeding 80%. (Modified from Stavros TA, Parker SH, Yakes YF, et al. Segmen- tal stenosis of the renal artery: pattern recognition of the tardus and parvus abnormalities with duplex sonography. Radiology. 1992;184:487–492.)
