
Page 335 - Libro 2
P. 335
20 — The Renal Vasculature
315
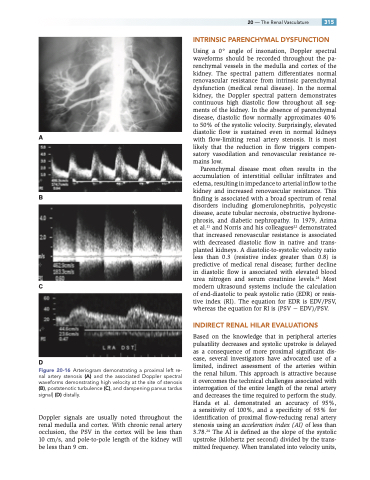
A
B
C
D
Figure 20-16 Arteriogram demonstrating a proximal left re- nal artery stenosis (A) and the associated Doppler spectral waveforms demonstrating high velocity at the site of stenosis (B), poststenotic turbulence (C), and dampening parvus tardus signal] (D) distally.
Doppler signals are usually noted throughout the renal medulla and cortex. With chronic renal artery occlusion, the PSV in the cortex will be less than 10 cm/s, and pole-to-pole length of the kidney will be less than 9 cm.
INTRINSIC PARENCHYMAL DYSFUNCTION
Using a 0° angle of insonation, Doppler spectral waveforms should be recorded throughout the pa- renchymal vessels in the medulla and cortex of the kidney. The spectral pattern differentiates normal renovascular resistance from intrinsic parenchymal dysfunction (medical renal disease). In the normal kidney, the Doppler spectral pattern demonstrates continuous high diastolic flow throughout all seg- ments of the kidney. In the absence of parenchymal disease, diastolic flow normally approximates 40% to 50% of the systolic velocity. Surprisingly, elevated diastolic flow is sustained even in normal kidneys with flow-limiting renal artery stenosis. It is most likely that the reduction in flow triggers compen- satory vasodilation and renovascular resistance re- mains low.
Parenchymal disease most often results in the accumulation of interstitial cellular infiltrates and edema, resulting in impedance to arterial inflow to the kidney and increased renovascular resistance. This finding is associated with a broad spectrum of renal disorders including glomerulonephritis, polycystic disease, acute tubular necrosis, obstructive hydrone- phrosis, and diabetic nephropathy. In 1979, Arima et al.21 and Norris and his colleagues22 demonstrated that increased renovascular resistance is associated with decreased diastolic flow in native and trans- planted kidneys. A diastolic-to-systolic velocity ratio less than 0.3 (resistive index greater than 0.8) is predictive of medical renal disease; further decline in diastolic flow is associated with elevated blood urea nitrogen and serum creatinine levels.23 Most modern ultrasound systems include the calculation of end-diastolic to peak systolic ratio (EDR) or resis- tive index (RI). The equation for EDR is EDV/PSV, whereas the equation for RI is (PSV EDV)/PSV.
INDIRECT RENAL HILAR EVALUATIONS
Based on the knowledge that in peripheral arteries pulsatility decreases and systolic upstroke is delayed as a consequence of more proximal significant dis- ease, several investigators have advocated use of a limited, indirect assessment of the arteries within the renal hilum. This approach is attractive because it overcomes the technical challenges associated with interrogation of the entire length of the renal artery and decreases the time required to perform the study. Handa et al. demonstrated an accuracy of 95%, a sensitivity of 100%, and a specificity of 93% for identification of proximal flow-reducing renal artery stenosis using an acceleration index (AI) of less than 3.78.24 The AI is defined as the slope of the systolic upstroke (kilohertz per second) divided by the trans- mitted frequency. When translated into velocity units,
