
Page 363 - Libro 2
P. 363
Velocities are recorded from the main portal vein, the portal vein end of the shunt, the mid shunt, the hepatic vein end of the shunt, and the IVC or outflow hepatic vein. The direction of flow should be noted within these vessels in addition to adjacent intrahe- patic portal veins, the splenic vein, and the superior mesenteric vein. The presence of ascites or varices should be noted.
In a patient with a well-functioning TIPS, hepa- tofugal flow may be present within the intrahepatic portal veins beyond the site of the stent connection with the portal vein. Color flow imaging should re- veal hepatopetal flow in the main portal vein with flow directed into the stent. The flow should continue in the direction of the hepatic vein and then out via the IVC. Color should be observed completely fill- ing the stent (Fig. 22-12). If a covered stent is used, acoustic shadowing may be present in the immedi- ate postprocedural period. This is a result of air be- ing trapped within the layers of the material used to cover the stent. After a brief period of time (usually 2 to 3 days), the air dissipates and the stent will be able to be completely insonated.
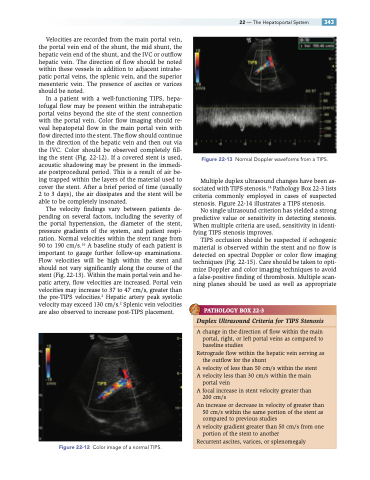
The velocity findings vary between patients de- pending on several factors, including the severity of the portal hypertension, the diameter of the stent, pressure gradients of the system, and patient respi- ration. Normal velocities within the stent range from 90 to 190 cm/s.16 A baseline study of each patient is important to gauge further follow-up examinations. Flow velocities will be high within the stent and should not vary significantly along the course of the stent (Fig. 22-13). Within the main portal vein and he- patic artery, flow velocities are increased. Portal vein velocities may increase to 37 to 47 cm/s, greater than the pre-TIPS velocities.2 Hepatic artery peak systolic velocity may exceed 130 cm/s.2 Splenic vein velocities are also observed to increase post-TIPS placement.
Figure 22-13 Normal Doppler waveforms from a TIPS.
Multiple duplex ultrasound changes have been as- sociated with TIPS stenosis.14 Pathology Box 22-3 lists criteria commonly employed in cases of suspected stenosis. Figure 22-14 illustrates a TIPS stenosis.
No single ultrasound criterion has yielded a strong predictive value or sensitivity in detecting stenosis. When multiple criteria are used, sensitivity in identi- fying TIPS stenosis improves.
TIPS occlusion should be suspected if echogenic material is observed within the stent and no flow is detected on spectral Doppler or color flow imaging techniques (Fig. 22-15). Care should be taken to opti- mize Doppler and color imaging techniques to avoid a false-positive finding of thrombosis. Multiple scan- ning planes should be used as well as appropriate
PATHOLOGY BOX 22-3
22 — The Hepatoportal System 343
Duplex Ultrasound Criteria for TIPS Stenosis
A change in the direction of flow within the main portal, right, or left portal veins as compared to baseline studies
Retrograde flow within the hepatic vein serving as the outflow for the shunt
A velocity of less than 50 cm/s within the stent A velocity less than 30 cm/s within the main
portal vein
A focal increase in stent velocity greater than
200 cm/s
An increase or decrease in velocity of greater than
50 cm/s within the same portion of the stent as
compared to previous studies
A velocity gradient greater than 50 cm/s from one
portion of the stent to another
Recurrent ascites, varices, or splenomegaly
Figure 22-12 Color image of a normal TIPS.
