
Page 111 - Libro vascular I
P. 111
Chap-08.qxd 1~9~04 16:41 Page 102
102
PERIPHERAL VASCULAR ULTRASOUND
in Table 8.2 include details of the sensitivity and specificity obtained by these criteria. Each center should verify its criteria locally by comparing the ultrasound findings with angiography or MRA. If a department has more than one scanner, it is
necessary to check the criteria used on each machine as different models of scanner may give different results. It is important for sonographers to under- stand how the results of their scans are used by the surgical or medical teams that have requested them and that these teams are aware of the method the sonographers use to define the degree of disease.
COMBINING B-MODE, COLOR IMAGING
AND SPECTRAL DOPPLER INFORMATION
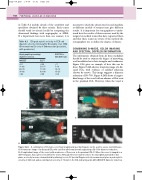
The information obtained from all three modalities should be used to estimate the degree of narrowing, as all modalities have their strengths and weaknesses. Figure 8.24 gives an example of how this can be done. Figure 8.24A shows a transverse image of a dis- eased ICA, with evidence of calcified atheroma (shown by arrow). This image suggests a diameter reduction of 50–70%. Figure 8.24B shows a longitu- dinal image of the vessel with an absence of flow seen in the proximal ICA. However, when the vessel is
Table 8.3 ICA peak systolic velocity to CCA end diastolic velocity criteria (after Nicolaides et al 1996 © International Society of Endovascular Specialists, with permission)
Angiographic percentage diameter stenosis
NASCET ECST
11 50 11–60 50–77 60–70 77–83 70–82 83–90 82 90
ICA PSV to CCA EDV ratio
7 7–10 10–15 15–25 25
ICA
ECA
ECA
D
ICA
C
ECA
A
ICA
B
Figure 8.24
A combination of B-mode, color flow imaging and spectral Doppler can be used to assess carotid disease. A: A transverse image of a diseased ICA, with calcified atheroma (arrow) suggesting a 50–70% diameter reduction.
B: A longitudinal image of the vessel with an absence of flow seen in the proximal ICA. C: When the vessel is imaged in a different plane, flow can be seen within the vessel. Although the vessel lumen looks to be only slightly narrowed in this plane, a velocity increase, demonstrated by aliasing, is seen. D: Spectral Doppler velocity measurement gives a peak systolic velocity of 200 cm/s and an end diastolic velocity of 75 cm/s in the ICA, indicating a 60–69% (NASCET) diameter reduction.
