
Page 136 - Libro vascular I
P. 136
Chap-09.qxd 29~8~04 14:46 Page 127
DUPLEX ASSESSMENT OF LOWER LIMB ARTERIAL DISEASE
127
O
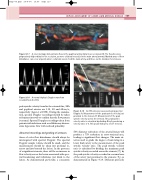
Figure 9.17 A color montage demonstrates flow in the popliteal artery distal to an occlusion (O). The flow becomes progressively higher distal to the occlusion, as more collateral vessels join the main artery (arrows). Marked areas of flow disturbance can occur at points where collateral vessels feed the main artery, and these can be mistaken for stenoses.
Figure 9.18 A normal triphasic Doppler waveform recorded from the SFA.
A
B AB
Figure 9.19 An SFA stenosis is assessed using spectral
peak systolic velocity found in the external iliac, SFA and popliteal arteries are 119, 90 and 68cm/s, respectively (Jager et al 1985). During the examina- tion, spectral Doppler recordings should be taken at frequent intervals to confirm that the flow pattern is normal. Spectral Doppler recordings taken from patients with infections such as cellulitis may demon- strate hyperemic flow with reduced pulsatility.
Abnormal recordings and grading of stenoses
Areas of color flow disturbance should always be interrogated with spectral Doppler. The spectral Doppler sample volume should be small, and the measurements should be taken just proximal to, across and just beyond the lesion. In the presence of a significant stenosis, there will be an increase in flow velocity across the lesion associated with spec- tral broadening and turbulence just distal to the lesion. As demonstrated previously, a concentric
Doppler. A: Measurement of the peak systolic velocity just proximal to the stenosis. B: Measurement of the peak systolic velocity across the stenosis. The peak systolic velocity ratio is calculated by dividing B by A, producing a velocity ratio of 5. This would indicate a severe stenosis.
50% diameter reduction of the arterial lumen will produce a 75% reduction in cross-sectional area, leading to significant flow changes. The main cri- terion used to grade the degree of narrowing in a lower limb artery is the measurement of the peak systolic velocity ratio. The peak systolic velocity ratio is calculated by dividing the maximum peak systolic velocity recorded across the stenosis (Vs) by the peak systolic velocity recorded in a normal area of the artery just proximal to the stenosis (Vp), as demonstrated in Figure 9.19. Different protocols
