
Page 137 - Libro vascular I
P. 137
Chap-09.qxd 29~8~04 14:46 Page 128
128
PERIPHERAL VASCULAR ULTRASOUND
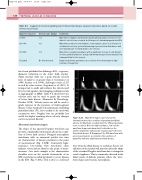
Table 9.5 Suggested criteria for grading lower limb arterial disease using velocity ratios, based on several references (see text)
Diameter reduction
0–49% 50–74%
75–99%
Occluded
Velocity ratio (Vs/Vp) 2
2
4
No flow detected
Comments
Waveform is triphasic but mild spectral broadening and an increase in end diastolic velocities are recorded as the degree of narrowing approaches 49%
Waveforms tend to become biphasic or monophasic; there is an increase in end diastolic velocity; spectral broadening is present; flow disturbance and some damping are recorded distal to the stenosis
Waveform is usually monophasic with a significant increase in end diastolic velocity; marked turbulence and spectral broadening are demonstrated; flow is damped distal to the stenosis
Doppler waveforms proximal to an occlusion often demonstrate a high- resistance flow pattern
A
B
Figure 9.20 Waveform shapes can reveal useful
have been published for defining a 50%, or greater, diameter reduction in the lower limb arteries. Many vascular units use a peak systolic velocity ratio of equal to or greater than 2 (Cossman et al 1989, Sensier et al 1996), although a ratio of 2.5 is used by other centers (Legemate et al 1991). It is important to audit and evaluate the criteria used by your unit against other imaging techniques such as angiography or MRA. Table 9.5 shows how the velocity ratio can be used to grade the severity of lower limb disease (Hennerici & Neuerburg- Heusler 1998). Velocity ratios can still be used to grade stenoses in the presence of multi-segment disease. Other methods of measurement, including pulsatility index (PI), have tended to be used with continuous wave Doppler but are probably less useful for duplex scanning where velocity changes can be measured directly.
Abnormal waveform shapes
The shape of the spectral Doppler waveform can provide considerable information about the condi- tion of lower limb arteries. Damped monophasic waveforms with an increased systolic rise time are characteristic of disease proximal to the point of measurement (Fig. 9.20B). Conversely, high- resistance, low-volume flow waveforms often indicate severe disease distal to the point of meas- urement. One such example is the characteristic shoulder seen on the systolic downstroke of an SFA waveform recorded proximal to severe disease in the SFA (Fig. 9.20A). This is due to a reflected
information about the condition of proximal and distal arteries. A: Waveform recorded from the SFA just proximal to an occlusion. Note the high-resistance, low-volume waveform shape and characteristic shoulder on the systolic downstroke (arrow), due to pulse wave reflection from distal disease. B: Damping of the CFA waveform with an increased systolic acceleration time and loss of pulsatility indicates significant proximal disease.
wave from the distal disease or occlusion. Severe cal- cification of the arterial wall may also affect the shape of the recorded Doppler waveform due to changes in vessel compliance. This is commonly observed in the tibial vessels of diabetic patients, where the wave- form shape may become monophasic.
