
Page 21 - Libro vascular I
P. 21
Chap-02.qxd 29~8~04 13:20 Page 12
12
PERIPHERAL VASCULAR ULTRASOUND
Aortic valve leaflets
Chest wall
Chest wall
Right ventricle Septum
Anterior mitral valve leaflet
Posterior mitral valve leaflet
Pericardium
Aorta Anterior mitral valve leaflet
Left atrium
Posterior mitral valve leaflet Posterior wall
Left ventricle
Interventricular septum Right ventricle
Time
Brightness proportional to amplitude of echoes
AB
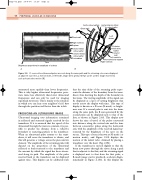
Figure 2.9 If consecutive ultrasound pulses are sent along the same path and the returning echoes are displayed as adjacent scan lines, a motion mode, or M-mode, image (A) is produced that can be used to image movement, such as heart valve motion (B).
attenuated more quickly than lower frequencies. This is why higher ultrasound frequencies pene- trate tissue less effectively than lower ultrasound frequencies and can only be used for imaging superficial structures. This is similar to the situation in which you can hear your neighbor’s hi-fi bass through the partition wall better than the treble.
PRODUCING AN ULTRASOUND IMAGE
Ultrasound imaging uses information contained in reflected and scattered signals received by the transducer. If it is assumed that the speed of the ultrasound through the tissue is constant, it is pos- sible to predict the distance from a reflective boundary or scattering particle to the transducer. When an ultrasound pulse returns to the trans- ducer, it will cause the transducer to vibrate, and this will generate a voltage across the piezoelectric element. The amplitude of the returning pulse will depend on the proportion of the ultrasound reflected or back-scattered to the transducer and the amount by which the signal has been attenu- ated along its path. The amplitude of the pulse received back at the transducer can be displayed against time. This display can be calibrated such
that the time delay of the returning pulse repre- sents the distance of the boundary from the trans- ducer, thus showing the depth of the boundary in the tissue. The varying amplitude of the signal can be displayed as a spot of varying brightness that travels across the display with time. This type of display is known as a B scan (B-mode) or bright- ness scan. If a second pulse is sent into the tissue along the same path, the B scan generated by the second pulse can be displayed next to that of the first, as shown in Figure 2.9A. This display now shows the time of travel of the pulses converted into distance along the vertical axis and the time between consecutive pulses along the horizontal axis, with the amplitude of the received signal rep- resented by the brightness of the spot on the screen. This type of scan is known as M-mode (or motion mode), and Figure 2.9A displays the motion of the mitral valve, obtained by placing a transducer over the heart (Fig. 2.9B).
If the transducer is moved slightly so that the beam now passes through the tissue along a path that is adjacent to the first, and the returning signal is displayed next to that from the first pulse, a B-mode image can be produced, as shown diagra- mmatically in Figure 2.10A. In this display the
Depth
