
Page 23 - Libro vascular I
P. 23
Chap-02.qxd 29~8~04 13:20 Page 14
14
PERIPHERAL VASCULAR ULTRASOUND
will increase both the high-amplitude signals detec- ted near the transducer and the lower amplitude signals detected from deeper in the tissue, which have been attenuated to a greater extent.
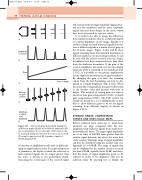
It is useful to be able to image the reflections from similar boundaries that lie at different depths at a similar brightness on the image. Equally, it is useful to image the back-scattered signals from tis- sues at different depths at a similar level of gray on the B-mode image. Figure 2.11A and B show signals returning from four identical boundaries at different depths in an attenuating medium. It can be seen that the echoes received from the deeper boundaries have been attenuated more than those from the shallower boundaries. If the gain of the receiver amplifier is increased over the time during which the pulse is returning to the transducer (Fig. 2.11C), it is possible to use greater amplification for the signal received from the deeper boundaries. By changing the gain over time, the returning echoes from the four boundaries can now be dis- played at a similar brightness (Fig. 2.11E). When the next pulse is transmitted, the gain would return to the baseline value and increase with time as before. This method of varying gain over time is known as time gain compensation (TGC) or depth gain compensation (DGC). The TGC control can usually be altered by a set of sliding knobs or pad- dles to allow different gains to be set for signals returning from different depths, as shown in Figure 2.11D.
DYNAMIC RANGE, COMPRESSION
CURVES AND GRAY-SCALE MAPS
Echoes reflected from tissue–air or tissue–bone interfaces are large compared with the low- amplitude back-scattered signals from small struc- tures within the tissue. The larger signal amplitudes are of an order of 100 000 times greater than the smallest signal detected, just above the noise level of the scanner. This large range of signal amplitudes can best be described using the decibel scale (see Appendix A) as 100 dB. The range of signals that can be displayed by the scanner monitor is much less than 100 dB, typically about 20 dB, and there- fore the range of signal amplitudes needs to be reduced in order to be displayed. This can be achieved either by selecting not to display the
A
Amplitude of echoes
B
Gain
C
Setting on gain controls
D
Amplitude of signal to be displayed
E
be increased during the time that the echoes are received (C) using the gain controls (D) to produce signals of similar amplitude (E).
no amount of amplification will assist in differenti- ating the signal from the noise. For a given frequency of transducer, the depth at which the reflected or back-scattered signals are no longer greater than the noise is known as the penetration depth. Increasing the overall gain of the received signal
Time or depth
Echoes returning from similar boundaries at different depths (A) will be of different amplitudes (B) due to attenuation. The receiver gain of the scanner can
Figure 2.11
