
Page 54 - Libro vascular I
P. 54
Chap-04.qxd 29~8~04 13:22 Page 45
short period of time) is also an important factor. The axial resolution of the color image is governed by the length of the individual sample volumes along each scan line. The lateral resolution of the color image depends on the width of the beam and the density of the scan lines across the field of view. The ability of the color image to follow the changes in flow over time accurately depends on the system having an adequate frame rate. Imaging arterial flow effectively usually requires a higher frame rate than does demonstrating venous flow, as changes in arterial flow occur much more rapidly.
The sensitivity of an ultrasound system to flow is another indication of the quality of the system and depends on many factors. First, the ultrasound fre- quency and output power must be appropriately selected to allow adequate penetration. Second, the time spent detecting the flow must be long enough to distinguish blood flow from stationary tissue. The filters used to remove wall thump and other tissue movement must be set so as not to remove signals from blood flow. The resolution and sensitivity of modern color flow systems have rapidly improved over the last decade, improving the range and quality of vascular examinations.
POWER DOPPLER IMAGING
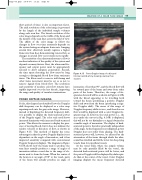
So far, this chapter has described how the Doppler shift frequency can be displayed as a color map superimposed onto the gray-scale image. However, instead of displaying the detected frequency shift, it is possible to display the back-scattered power of the Doppler signal. The color scale used shows increased luminosity with increased back-scattered power. This allows the scanner to display the pres- ence of moving blood, but it does not indicate the relative velocity or direction of flow, as shown in Figure 4.15. This method of display has some advantages in that the power Doppler display is not dependent on the angle of insonation, and it has improved sensitivity compared with conventional Doppler frequency displays. The diagram in Figure 4.16A shows how the beam used to produce the scan lines actually produces a range of angles of insonation within a vessel due to the range of ele- ments used to form the beam. When the center of the beam is at an angle of 90° to the vessel, parts of the beam will actually produce an angle of
Power Doppler image of a diseased internal carotid artery, showing a narrow flow
channel.
CREATION OF A COLOR FLOW IMAGE
45
Figure 4.15
insonation of less than 90°, and the blood flow will be toward part of the beam and away from other parts of the beam. Therefore, the range of fre- quencies detected will be as shown in Figure 4.16B, with the blood appearing to be travelling both toward the beam (producing a positive Doppler shift) and away from the beam (producing a nega- tive Doppler shift). The mean of this range of Doppler frequency shifts is zero, and therefore no flow would be displayed with a color Doppler fre- quency map. If, however, the total power (i.e., the area under the curves in Fig. 4.16B) is displayed, this will not be too dissimilar to a signal obtained at a smaller angle of insonation. The display of back- scattered power is therefore practically independent of the angle. As the frequency is not displayed, power Doppler does not suffer from aliasing. The back- scattered power will, however, be affected by the attenuation of the tissue through which the ultra- sound has travelled and will be lower for deep-lying vessels than for superficial vessels.
At the vessel walls, where the sample volume may be only partially filled by the vessel, the detected back-scattered power will be lower, and the power Doppler will be displayed by darker pix- els than at the center of the vessel. Color Doppler imaging displays the mean frequency detected
