
Page 67 - Libro vascular I
P. 67
Chap-05.qxd 29~8~04 13:25 Page 58
58
PERIPHERAL VASCULAR ULTRASOUND
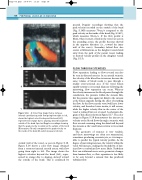
spectral Doppler recordings showing that the peak velocity recorded on the outside of the bend (Fig. 5.16B) measures 70cm/s compared to the peak velocity on the inside of the bend (Fig. 5.16C), which measures 55 cm/s. If the flow profile is blunt, when it enters a bend in the vessel (as seen in the ascending aorta), the profile becomes skewed in the opposite direction (i.e., toward the inner wall of the curve). Secondary helical flow also occurs at bifurcations, as the daughter vessels bend away from the path of the parent vessel, leading to skewed velocity profiles in the daughter vessels (Fig. 5.13).
FLOW THROUGH STENOSES
Flow separation leading to flow reversal can also be seen in diseased arteries. At an arterial stenosis, the velocity of the blood has to increase because the same volume of blood needs to pass through a smaller cross-sectional area. If the vessel lumen rapidly returns to its normal diameter following the narrowing, flow separation can occur. Whereas the velocity increases as the blood passes through the constriction, the pressure within the stenosis falls, but the pressure rises again just distal to the stenosis as the lumen expands, having the effect of retarding the flow. As the flow near the vessel wall has a lower velocity, and therefore lower inertia, it will reverse, while the higher velocity flow in the center of the vessel is reduced but not reversed. A schematic dia- gram of this effect is shown in Figure 5.17. The color image in Figure 5.18 demonstrates the increase in velocity as the blood flows through a stenosis, with flow reversal occurring along the distal wall beyond the stenosis as the vessel lumen returns to its normal diameter.
The geometr y of stenoses is ver y variable, and these narrowings are often not symmetrical, sometimes producing eccentric jets, so it is impos- sible to predict the typical velocity profiles. As the degree of narrowing increases, the velocity within the vessel will increase, making the breakdown of lam- inar flow to turbulent flow more likely. Turbulent flow can withstand more acute geometric changes than laminar flow, so flow separation is less likely to be seen beyond a stenosis that has produced turbulent flow.
BC
A
B
C
Figure 5.16 A: Color flow image from a tortuous internal carotid artery, with flow going from right to left, shows the highest velocities beyond the bend (left), represented in orange due to aliasing, skewed toward the outside of the bend. Spectral Doppler recordings showing that the peak velocity recorded on the outside of the bend (B) measures 70 cm/s compared to the peak velocity on the inside of the bend (C), which measures 55 cm/s.
outside wall of the vessel, as seen in Figure 5.15. Figure 5.16 shows a color flow image obtained from a tortuous internal carotid artery, with flow going from right to left. The image shows the highest velocities beyond the bend (left), repre- sented in orange due to aliasing, skewed toward the outside of the bend. This is confirmed by
