
Page 68 - Libro vascular I
P. 68
Chap-05.qxd 29~8~04 13:25 Page 59
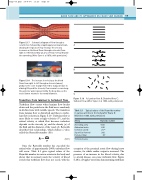
Figure 5.17 Schematic diagram of flow through a constriction followed by a rapid expansion downstream, A showing the regions of flow reversal. The velocity
increases as the blood flows through a stenosis (from
right to left) followed by an area of flow reversal beyond
the narrowing. (After Caro et al 1978, with permission.)
ICA
CCA B
Figure 5.18 The increase in velocity as the blood
flows from right to left through a stenosis (arrow) produces the color change from red to turquoise (due to aliasing). Beyond the stenosis, flow reversal occurs along the posterior wall, represented by the deep blue, as the vessel lumen returns to its normal diameter.
Transition from laminar to turbulent flow
C
BLOOD FLOW AND ITS APPEARANCE ON COLOR FLOW IMAGING
59
A: Laminar flow. B: Disturbed flow. C: Turbulent flow. (After Taylor et al 1995, with permission.)
Figure 5.19
Turbulent flow occurs when laminar flow breaks down and the particles in the fluid move randomly in all directions with variable speeds. The transition from laminar flow to disturbed and then to turbu- lent flow is shown in Figure 5.19. Turbulent flow is more likely to occur at high velocities (V), and the critical velocity at which flow becomes turbulent depends on the viscosity () and the density () of the fluid and the diameter of the vessel (d). Reynolds described this relationship, which defines a value called the Reynolds number (Re):
Table 5.1 Typical values of the Reynolds number in various arteries in the body (after Evans & McDicken 1999, with permission)
Artery
Ascending aorta Abdominal aorta Common carotid Superficial femoral Posterior tibial
* Estimated values.
Reynolds number
1500 640
217* 200
35*
Re dVr m
(5.9)
Once the Reynolds number has exceeded the critical value of approximately 2000, turbulent flow will occur. Table 5.1 gives typical values of the Reynolds number in various arteries in the body and shows that in normal vessels the velocity of blood is such that turbulent flow does not occur, with the
exception of the proximal aortic flow during heavy exercise, for which cardiac output is increased. The presence of an increase in the blood velocity, due to arterial disease, can cause turbulent flow. Figure 5.20 is a Doppler waveform demonstrating turbulent
Vein
